overview
Point groups are registered from the Point Group Registration screen. This must be done from the Settings screen while the monitoring system is running.
The following explains how to register a point group. Please note that the following operations should be performed while both Panel Server and Panel Browser are online.
•Display point group registration screen
•Specify the calculation formula
|
If you want to know more about point groups, see "Point Groups and Graph Groups" for details. |

|
"Energy Management in Practice" provides a sample of a typical setting example. The sample has point groups registered, so you can use it as a reference when actually using it. |
Display of point group registration screen
Point groups can be registered on the point group registration screen.
This setting screen can be called up from the Energy Management screen menu.
To display the menu, click the settings icon (gear icon) in the top right corner of the screen.
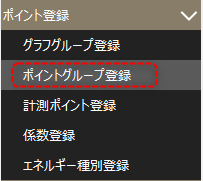
From the menu displayed on the right side of the screen, open "Point Registration" and select "Point Group Registration."
The settings screen is displayed.
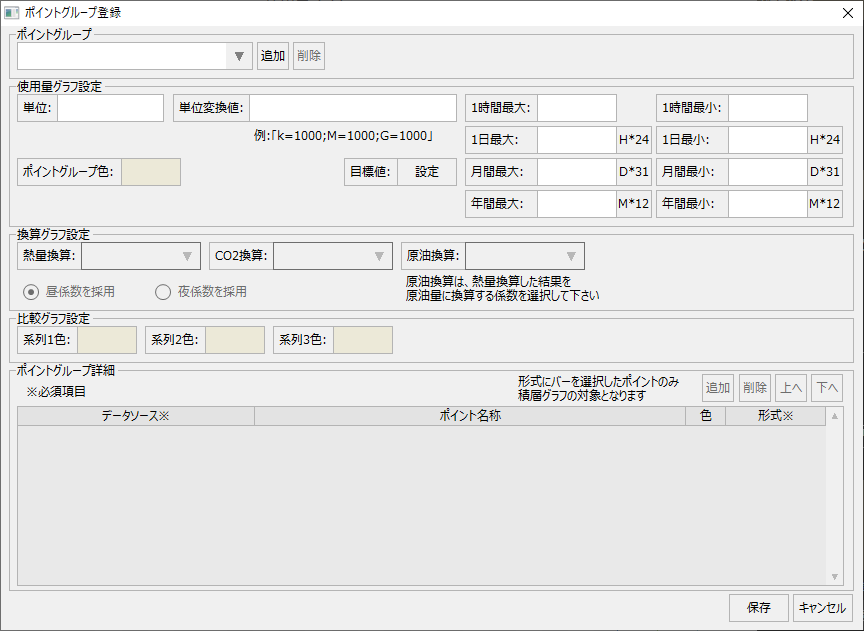
When registering a point group, you can select the weighing points to be included in the group, assign the display color for each graph, assign coefficients to be used when displaying conversion graphs, and set target values.
The steps to register a point group are as follows:
■ Adding a point group
|
The image on the left indicates that no point groups have been registered.
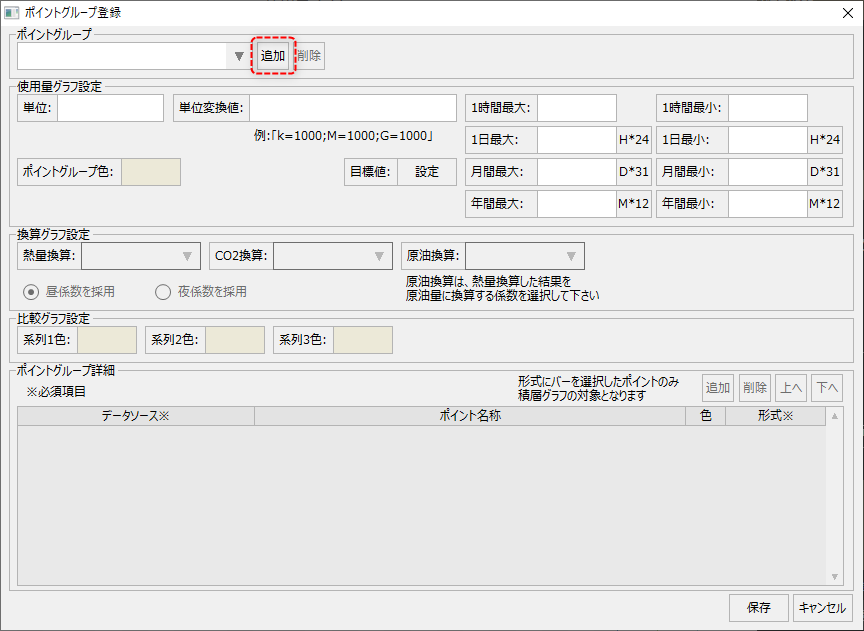
To add a point group, click the Point Groups Add button.
|
|
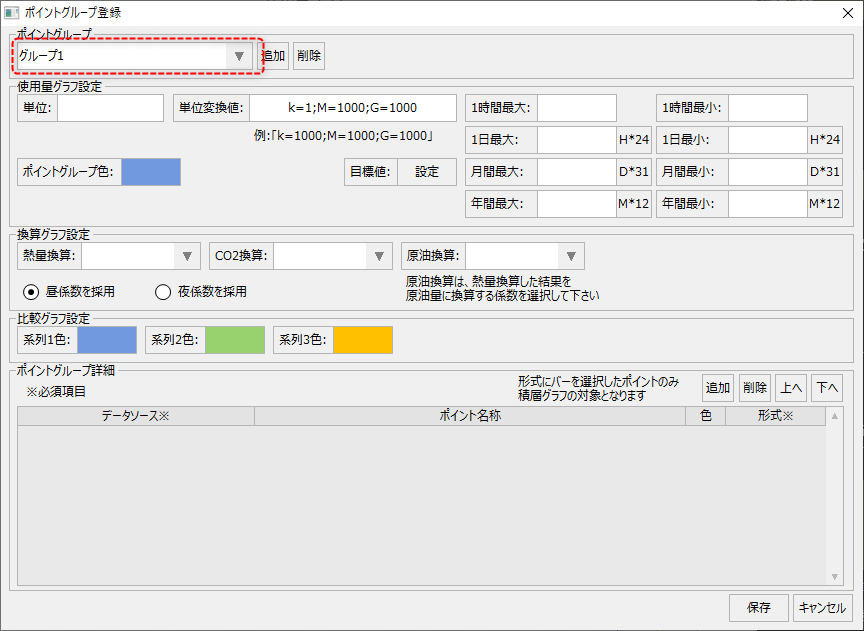
This will add a point group named "Group 1" and display initial values such as the graph display color and unit conversion value. You can freely change the settings such as the initial displayed name.
Below is an example where the name has been changed to "Head Office Air Conditioning Power."
|

■ Usage graph settings
|
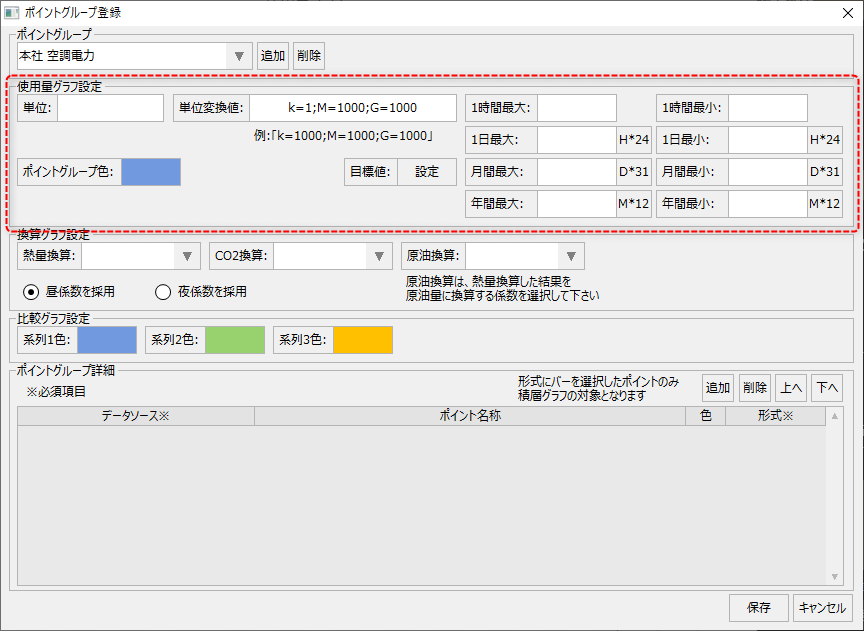
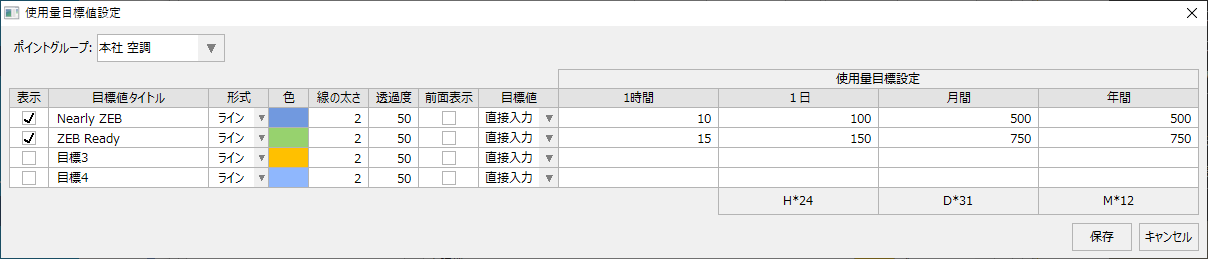
The following items are configured in the usage graph settings:
(Example)
|

■ Conversion graph settings
|
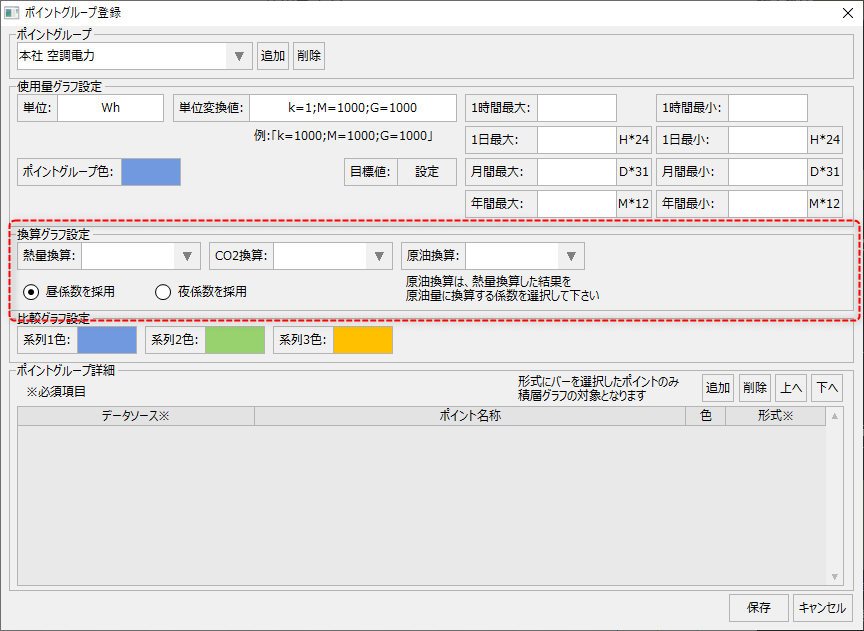
The conversion graph settings include the following:
(Example)
|

|
If you want to perform separate day and night tallying, you will need to register separate point groups for day and night.
|
■ Comparison graph settings
|
The comparison graph settings include the following:
|
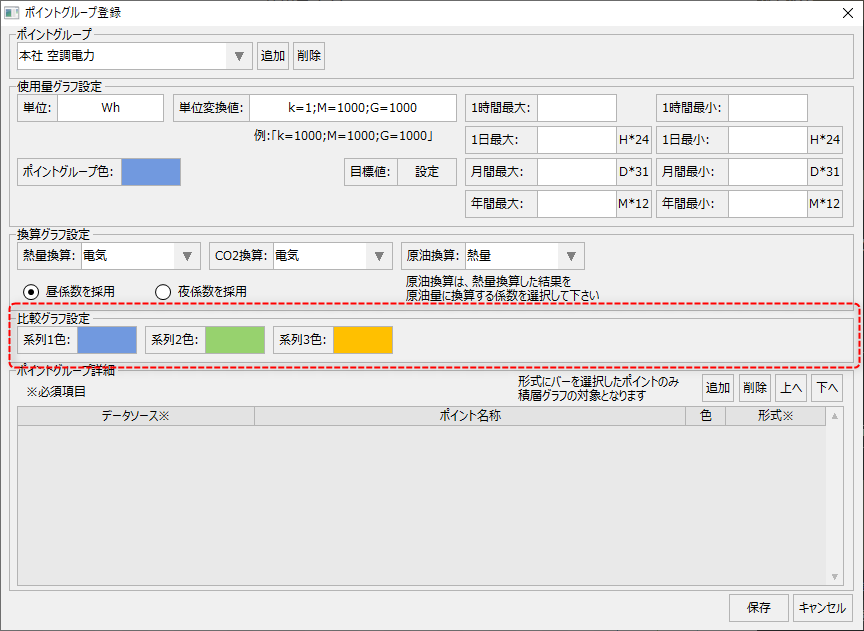
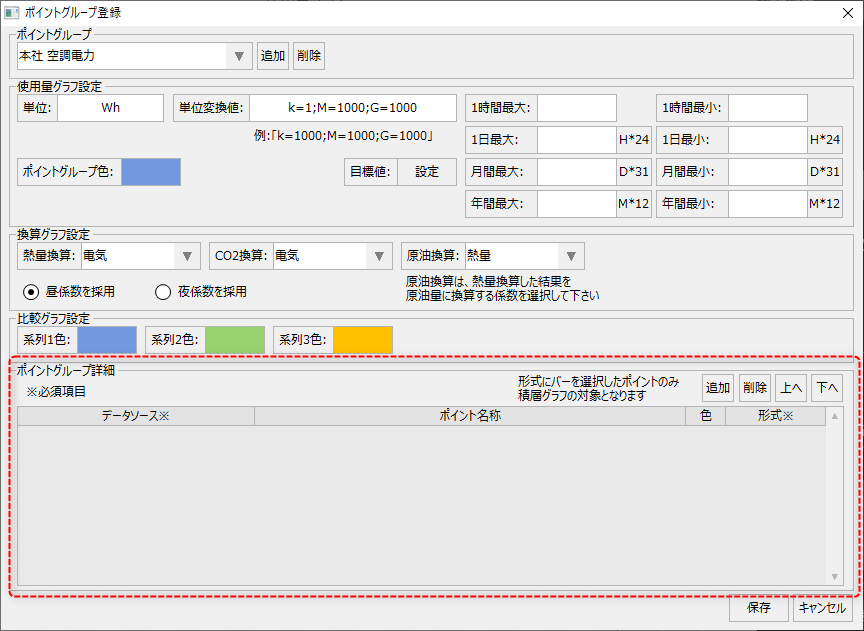
■Point group details
From the point group details grid, register the weighing points to be included in the currently selected point group.
|
|
To add a point, click the Add button.
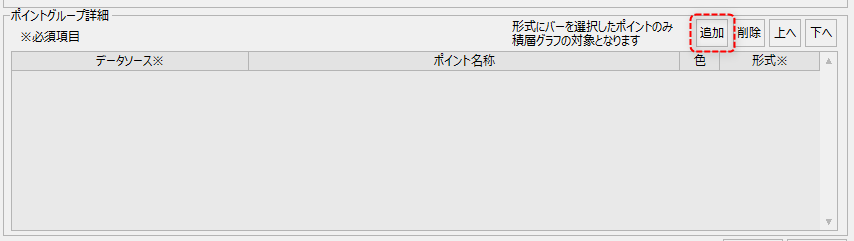
Then a new line was added.

First, select the data source. To select the data source, click the button below.

The following selection screen will then be displayed. Select the desired data source and click the OK button.
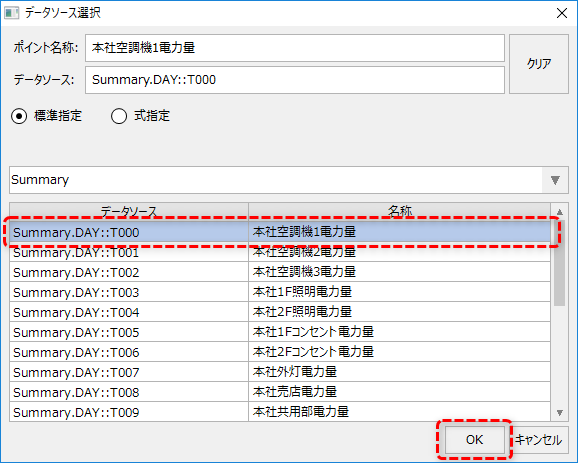
The data source has been selected.

The name of the selected field is initially displayed as the point name, but this name can be freely changed. Edit it directly as necessary.
In addition, a display color is automatically assigned. This display color is used when the breakdown of point groups is displayed in a graph, such as a usage graph.
Next, select the graph display format.

The display format can be selected from "bar," "line," or "area."Furthermore, only data sources for which "Bar" is selected will be subject to layered display.So in most cases, you'll want to choose "Bars" to display usage.
•Bar: Bar graph display
•Line: Line graph display
•Area: Fill in the area with a line graph
(Example)

Once you have completed the configuration, click the OK button to save the settings.
Specify the calculation expression
When registering point information in a point group, you can include calculated values for the measurement points and calculation formulas between measurement points.
The point operation is specified through the data source selection dialog.
Below is the initial display of the data source selection dialog.
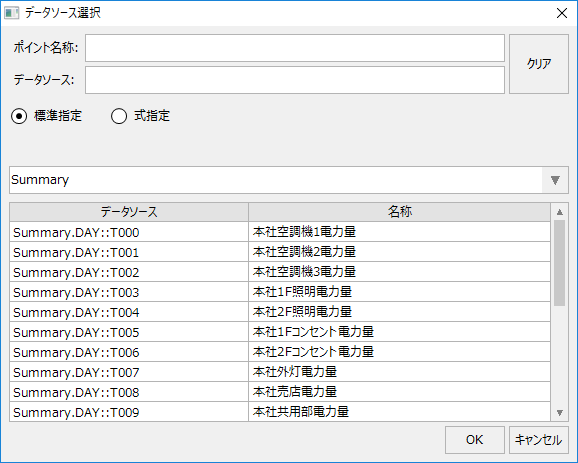
To specify an expression, select the option "Specify Expression" on the screen.

Then the display will change to the following:
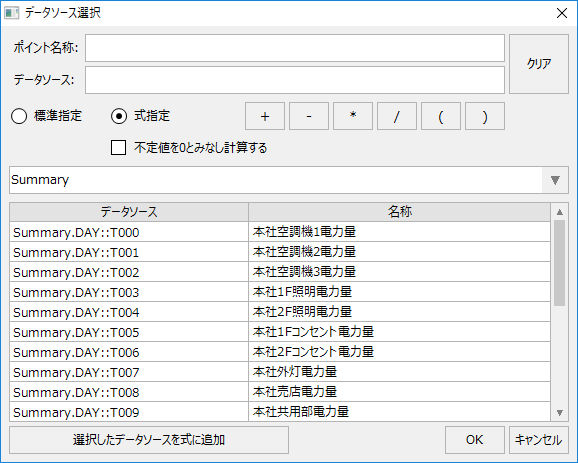
Select the data source you want to use for the calculation and click the "Add selected data source to expression" button.
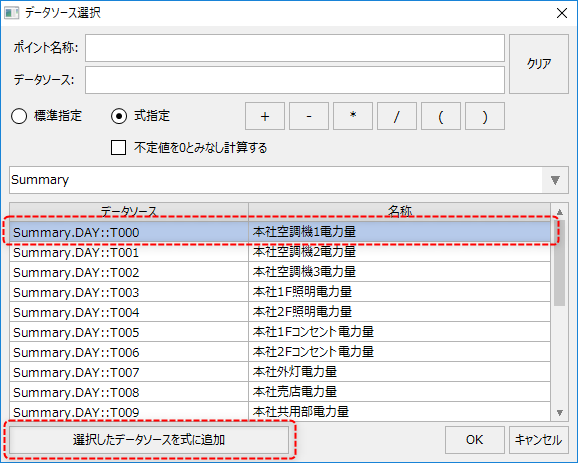
The selected data source will then be displayed in the data source edit box.

You can edit this edit box directly, or you can click the operator buttons such as "+" and "*" to add them to the formula (you can also enter operators from the keyboard).
Below is an example of adding two fields together.

The following is an example of importing a value that is 0.7 times the field value.

Below is an example that takes the average value of two fields.

|
The formula can also include spaces. (Example with half-width spaces before and after "*") |
