overview
Graph groups are registered from the Graph Group Registration screen, which must be done from the Settings screen while the monitoring system is running.
The procedure for registering a graph group is explained below. Please note that the following operations should be performed while both Panel Server and Panel Browser are running online.
•Displaying the graph group registration screen
|
If you want to know more about graph groups, see "Point Groups and Graph Groups" for more information. |

|
"Energy Management in Practice" provides a sample of a typical configuration example. The sample has a graph group registered, which can be used as a reference when actually using the system. |
Display of graph group registration screen
Graph groups are registered on the Graph Group Registration screen.
This setting screen can be called up from the Energy Management screen menu.
To display the menu, click the settings icon (gear icon) in the top right corner of the screen.
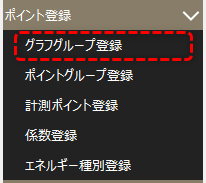
From the menu displayed on the right side of the screen, open "Point Registration" and select "Graph Group Registration."
The settings screen is displayed.
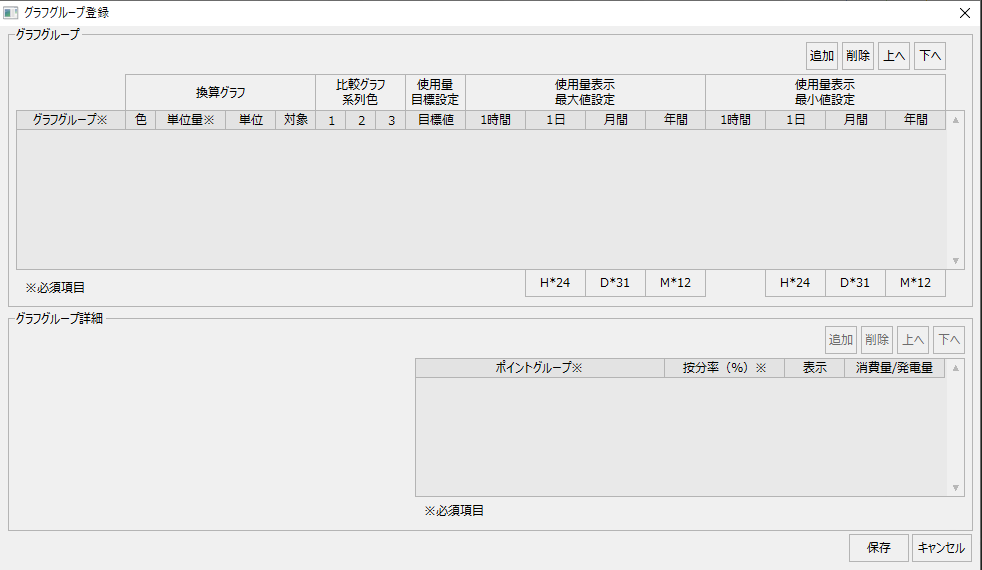
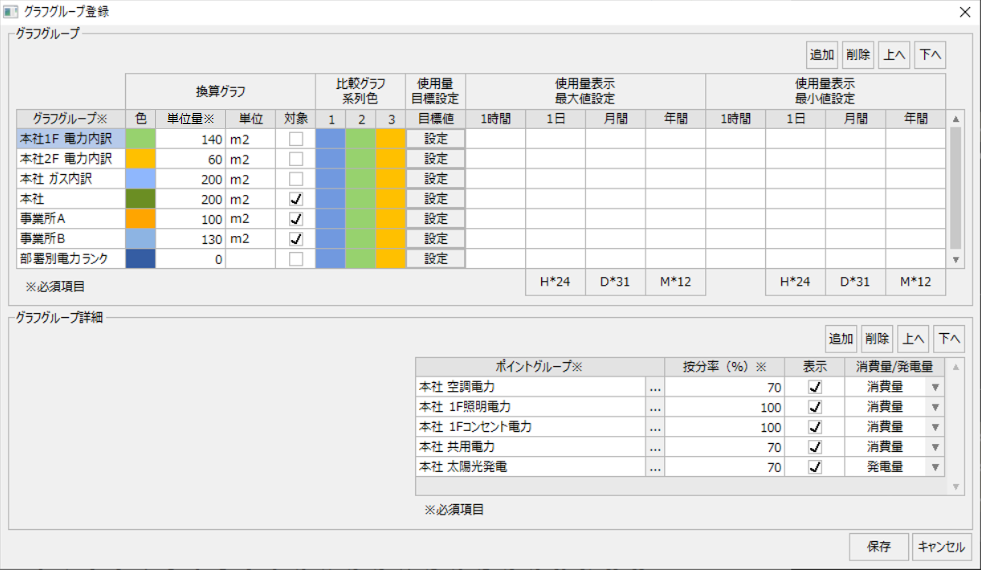
When registering a graph group, you set the point groups to be included in the group, the display color of each graph, the unit amount of energy intensity, and the target value of usage.
The procedure for registering a graph group is as follows:
■ Adding a graph group
|
The image on the left shows a state where no graph groups have been registered.
To add a chart group, click the Chart Group's Add button.
|
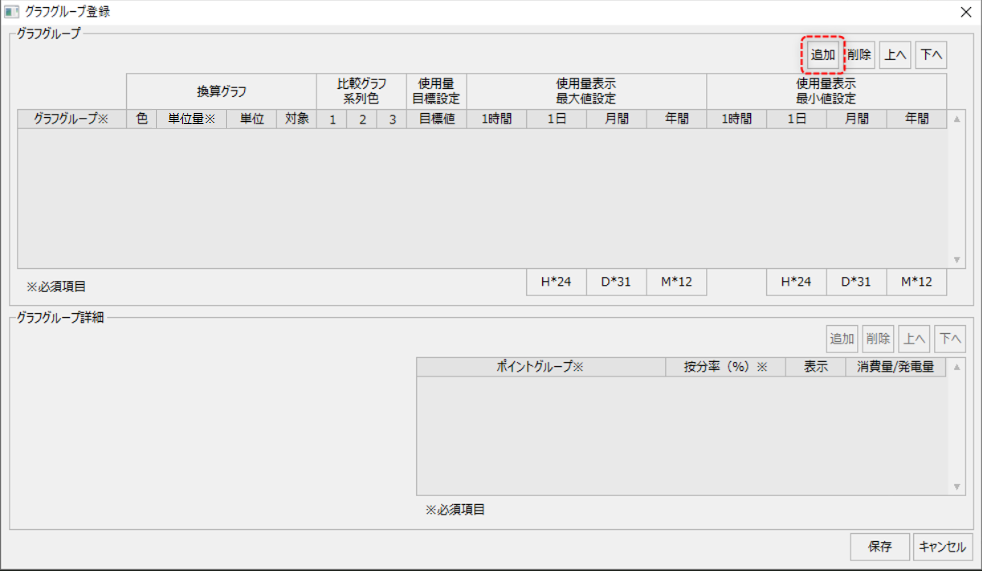
A new row will be added to the list of chart groups.

In the blank line above, set the name, unit amount, unit, display color, target usage value, maximum usage value, and minimum usage value for the graph group you want to register.
In the unit amount field, specify the numerical value of the index value used as the denominator when calculating the energy intensity. In the unit field, specify the unit of the unit amount to be used as the denominator. If you want to display this graph group in the conversion graph, check the "Target" field for the conversion graph. If you want to know the relationship between graph groups and the conversion graph display, please refer to "Relationship between groups and graph display".
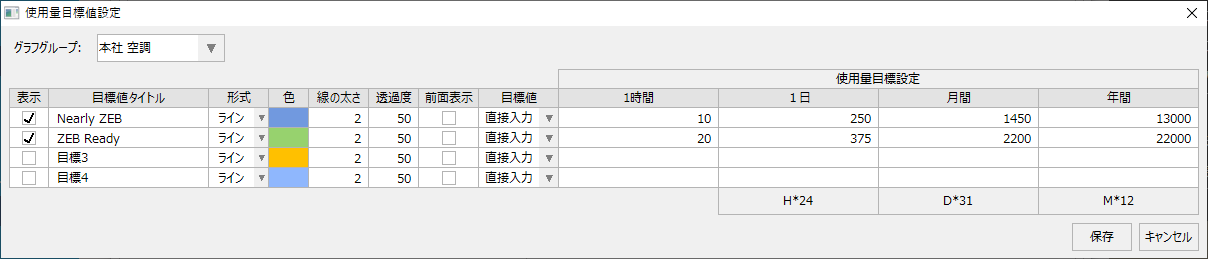
You can also set a usage target value for each graph group. When you set a target value, a line of the target value can be displayed on the graph. You can set the target value from the setting screen that appears when you click the setting button. From the setting screen, you can set the appearance of the target value, such as the title, display format (line, area), and display color, and enter the target value for each hour (day display), day (month display), month (year display), and year (multi-year display). Clicking the "H*24", "D*31", or "M*12" button will calculate the daily (24 hours), monthly (31 days), and yearly (12 months) hourly target.
(Graph group/Usage target value setting screen)
The maximum and minimum display values for usage are referenced when displaying the usage graph. If left blank, they will be treated as automatic.
Below is an example configuration.

|
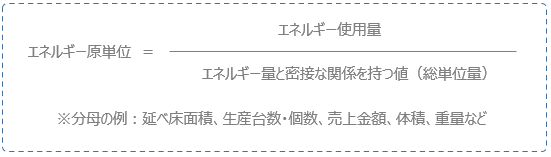
In energy management, the "energy intensity" is an index used to measure the consumption efficiency of various types of energy, and is defined as follows:
The value specified for the denominator is free and varies depending on the type and concept of the monitored facility. For example, for a building, it could be the total floor area, for a commercial facility, it could be the number of visitors or sales amount, for a factory, it could be the number of units or items produced, and for a hotel, it could be the number of beds (maximum occupancy).
The calculated energy intensity is displayed at the top of each conversion graph.
(Example: Energy consumption rate displayed on a CO2 conversion graph)
|

■ Graph group detailed settings
After you add a Chart Group, you select the Point Groups to include in the Chart Group.
|
To add a point group to the graph group, click the "Add" button on the left.
|
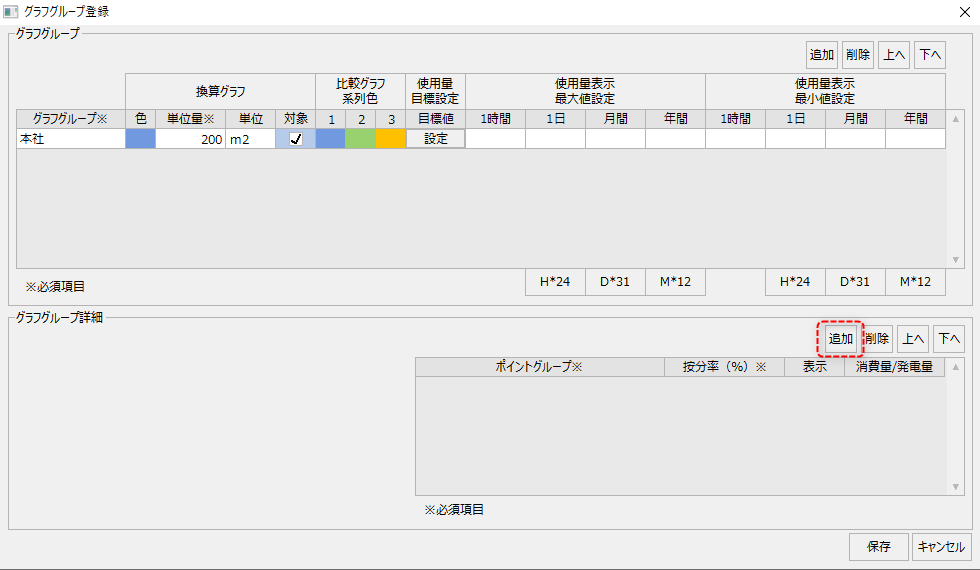
A new row will now be added to the list of point groups.

To add a point group, click the selection button below.

The following selection screen will then be displayed.
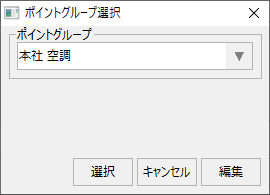
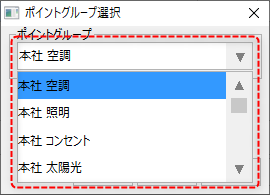
When you open the combo box above, a list of point groups that have already been registered will be displayed. Select the desired point group from the list and click the "Select" button.
After selecting a point group, set the allocation rate, display target, and consumption/power generation classification.

The allocation rate specifies what percentage of the point group usage should be included in the target graph group. If you want to include everything, enter "100".
If you want to display the graph, check "Show." If you uncheck this, it will be excluded from the graph display.
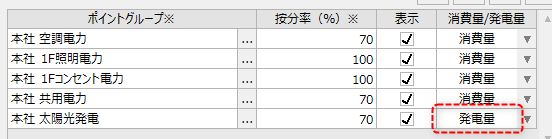
For Consumption/Power Generation, select whether the usage for the point group is consumption or power generation (energy creation).

Once you have completed the configuration, click the OK button to save the settings.
(Graph group setting example)
|
Data from a point group for which "Power generation" is selected in the point group settings to be included in a graph group will be treated as negative values when the usage graph is displayed as "Power generation/consumption."
(Example of usage graph/display method "power generation/consumption")
|
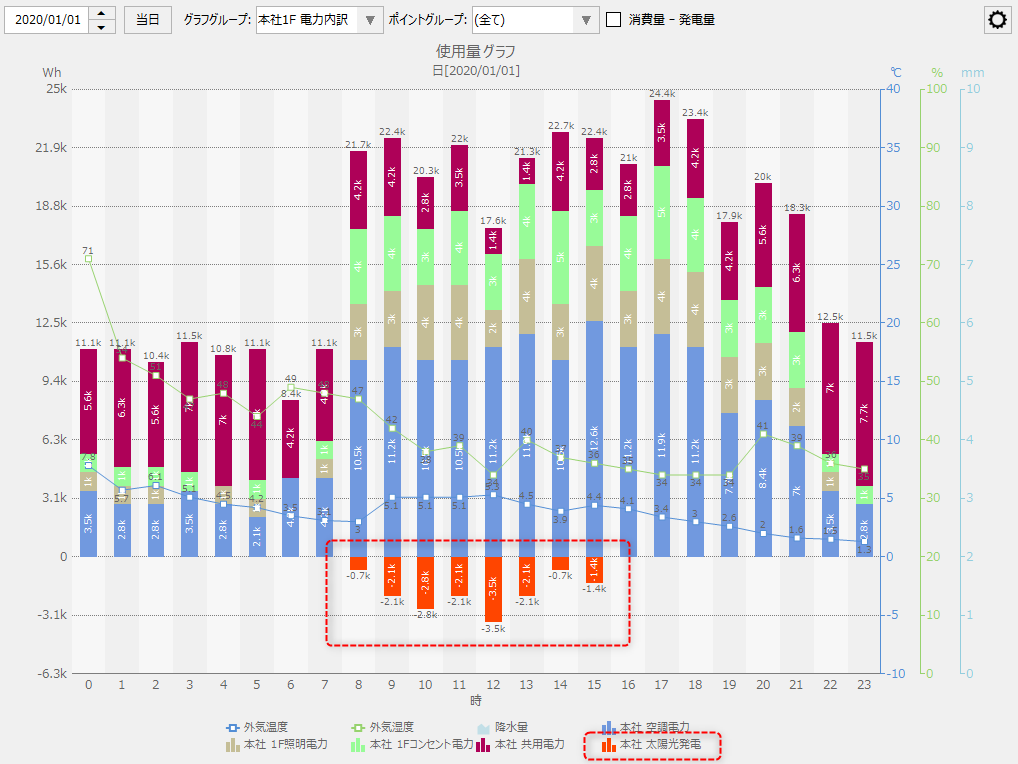
|
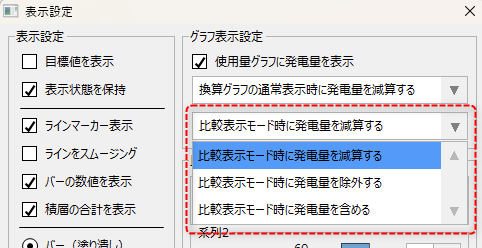
In the normal display (when no display mode is selected) of the energy conversion graph, CO2 conversion graph, and crude oil conversion graph, the total value of the measurement data of each group registered as the display target of the conversion graph in the graph group settings is first calculated, and then the conversion result calculated based on the conversion coefficient registered in advance is displayed on the graph. If the group to be displayed includes power generation (created energy), you can select whether to convert and display the amount by subtracting the amount of power generation from the amount of consumption, excluding the amount of power generation from the conversion display, or including the amount of consumption and power generation in the total without distinguishing between them. This display method can be set from the "Display setting screen".
(Display settings screen)
|
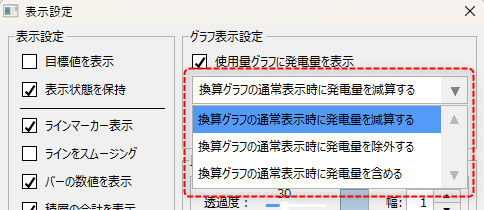
|
In the comparison display mode for the consumption graph, energy conversion graph, CO2 conversion graph, and crude oil conversion graph, the total values of each measurement data included in the graph group and point group selected from the screen are displayed side by side for comparison. If the selected group includes power generation (energy creation), you can select whether to display the total without distinguishing between consumption and power generation, exclude power generation from the comparison display, or display the amount obtained by subtracting power generation from consumption. You can set this display method from the "Display setting screen".
(Display settings screen)
|