overview
Measurement values can be overlaid on the energy consumption graph and conversion graph. For example, by overlaying measurements such as outdoor temperature and humidity on the graph, you can see how these measurements affect energy consumption.
Measurement points are registered from the Measurement Point Registration screen. This must be done from the Settings screen while the monitoring system is running.
The procedure for registering measurement points is explained below. Please note that the following operations should be performed while both Panel Server and Panel Browser are online.
•Display of measurement point registration screen
•Registering measurement points
|
To display a measurement value on a graph, the target measurement value must be included in the logging and aggregation data. |

|
"Energy Management in Practice" provides a sample of a typical configuration example. The sample has measurement points registered, so you can use it as a reference when actually using it. |
Display of measurement point registration screen
Measurement points are registered on the measurement point registration screen.
This setting screen can be called up from the Energy Management screen menu.
To display the menu, click the settings icon (gear icon) in the top right corner of the screen.
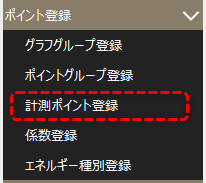
Open "Point Registration" from the menu displayed on the right side of the screen and select "Measurement Point Registration."
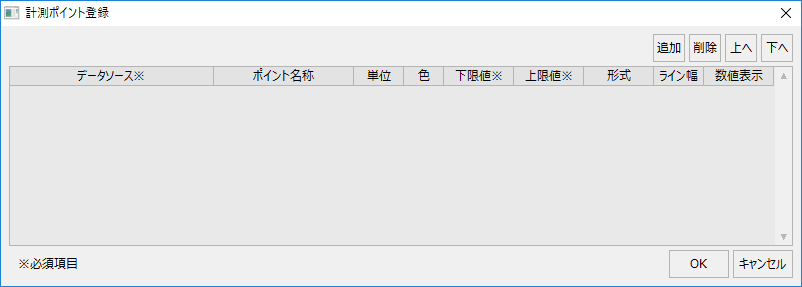
The settings screen is displayed.
Registering measurement points
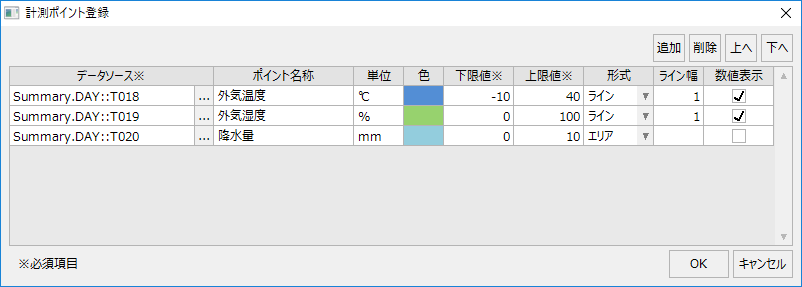
When registering a measurement point, you set the data source, point name, unit, display color, upper limit value, lower limit value, display format, etc. of the measurement point you want to display on the graph.
The procedure for registering a measurement point is as follows:
■ Adding measurement points
To add a measurement point, click the Add button.

A new line will be added to the list.

First, select the data source. Click the button below to display the selection screen.

This will display the data source selection dialog.
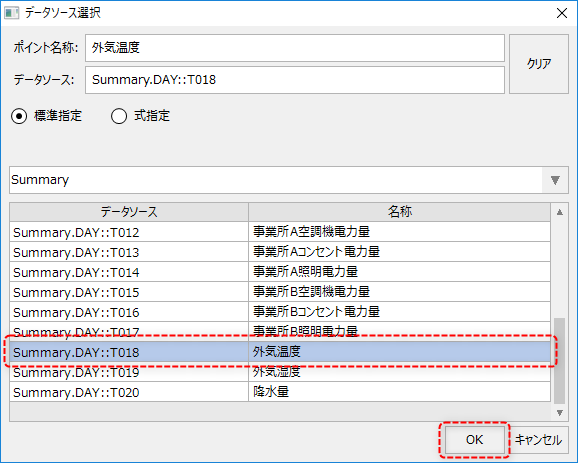
Select the data source for the desired measurement from the list and click the OK button.
The data source has been selected.

Next, set the unit, color, lower limit, upper limit, format, line width, and whether or not to display numeric values.
Please directly enter any characters into the unit (such as "℃"). The lower limit and upper limit specify the range of values to be displayed on the graph. You must specify these settings.
The display format of the measurement points can be selected from the combo box below. You can select either "Line" or "Area".
|
Line: Displays as a line graph. Area: Displays the area by filling it with lines.
For the format of each display, see "Energy Management (EMS)" in the library reference. |

Once you have completed the configuration, click the OK button to save the settings.
(Example of setting measurement points)