Operation monitoring feature introduction
Here we will explain what you can do with operation monitoring, along with screen images.
Clicking on a link in the table below will take you to the corresponding section of this page.
function |
Screen Name |
explanation |
Operation status monitor screen
|
The current operating status of equipment can be monitored and displayed in real time.
On the operation status monitor screen, you can display multiple equipment display frames side by side on the screen, a so-called "Andon display." You can flexibly change the layout of the display frames and the data items displayed within the frames.
|
|
Timeline screen Operational performance screen
|
Based on log data on operation, shutdown, abnormalities, etc. of the monitored equipment, the operating status on a daily basis can be displayed on the screen.
On the Timeline screen, you can display the operation status of equipment, such as operation and shutdown, as a chronological Gantt chart. Select any date and group from the screen, and the equipment registered in the target group will be displayed vertically, with the Gantt chart displayed color-coded by operation time, shutdown time, abnormal time, other time, etc.
The operation record screen allows you to display the operation record of equipment in a list format. By selecting any date and group from the screen, you can display the aggregated values such as operation time, stop time, number of operations, number of stops, number of abnormalities, operation rate, production target, production record, progress rate, etc. for each piece of equipment registered in the target group in a list format.
|
|
Monthly Report Timeline Screen Monthly operation results screen
|
Based on log data on operation, shutdown, abnormalities, etc. of the monitored equipment, the operating status on a monthly basis can be displayed on the screen.
The Monthly Report Timeline screen is a screen for displaying the operation status of the equipment selected from the screen for one month in a Gantt chart. The operation status such as operation time and stop time of the equipment for the year and month selected from the screen is displayed in a Gantt chart with one line per day for one month.
The monthly operation results screen is a monthly report screen for the operation results of equipment. The aggregated values of the daily operation status for the year and month selected on the screen are arranged on a grid and displayed. The monthly report data can be printed as a monthly report or saved to a CSV file.
|
|
Operation analysis screen
|
By using the operation analysis screen, you can display detailed operation data of the equipment.
On the operation analysis screen, you can select any date and equipment from the screen to display time aggregate values such as operation time and stop time of the target equipment, detailed breakdown of each time aggregate, number of operation times, number of stop times, number of abnormalities, operation rate, etc. In addition, by setting the production target and production result collection, you can also display the production target, actual results, and progress rate.
Furthermore, multiple date ranges can be specified on this screen, and the aggregated values for the specified date ranges can be displayed.
|
|
Monthly report bar graph screen Monthly report stacked graph screen
|
The "Monthly Report Bar Graph Screen" and "Monthly Report Stacked Graph Screen" are provided as analysis tools for operational status.
The monthly bar graph screen displays the equipment operation results as a bar graph on a monthly basis. The aggregated values of the operation status for the year and month selected from the screen are displayed side by side in up to three bar graphs. The data displayed in the graph can be freely selected from various aggregated data such as production targets, production results, operation time, and downtime.
The monthly stacked graph screen displays the equipment operation status as a stacked graph on a monthly basis. For the year and month selected on the screen, the operation time, stop time, abnormal time, and other time for the equipment are displayed in a stacked graph.
|
Monitoring operation status (Andon display)
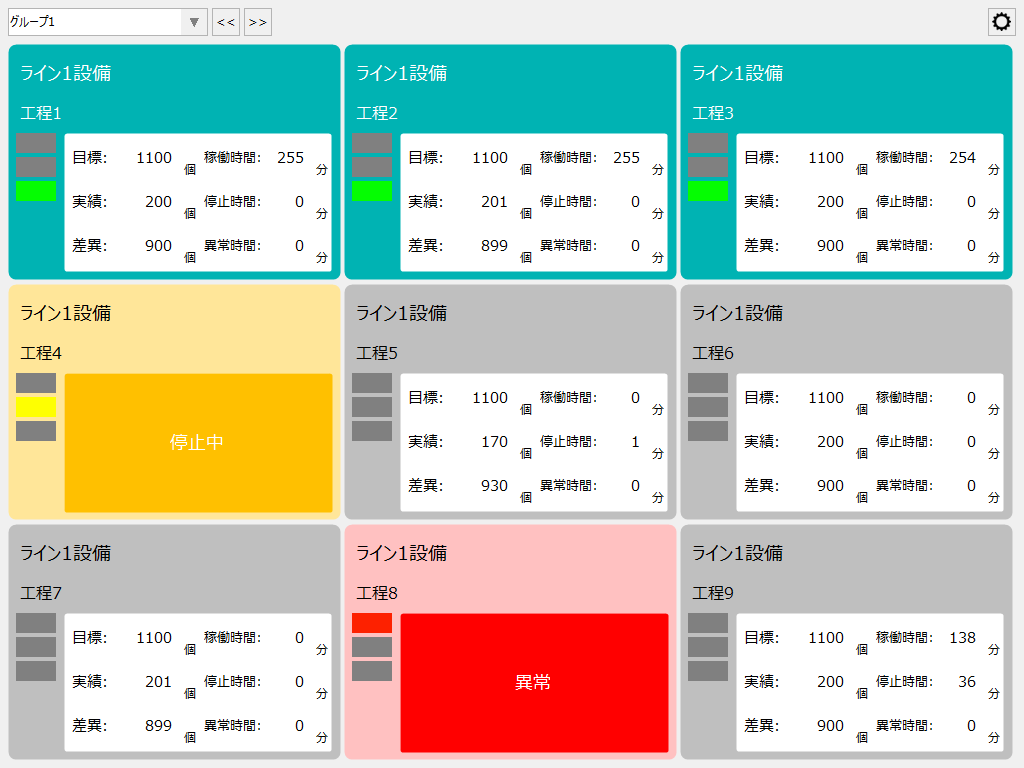
The "Operation Status Monitor" screen for operation monitoring is used to monitor and display the current operation status of equipment.
It is possible to display multiple equipment display frames side by side on the screen, a so-called "Andon display."
(Operation status monitor screen)
■About the display frame of the operation status monitor
The Operation Status Monitor displays information about monitored equipment in individual display frames on the screen. When configuring the display frames, you can flexibly change the frame display size (number of vertical and horizontal merges), display layout, data items to be displayed, number of left lamps to be displayed vertically in the left column of the frame, and allocation of data to be displayed.
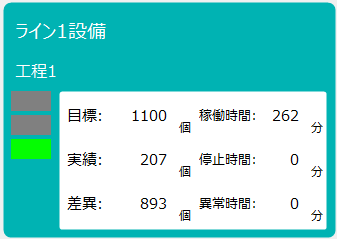
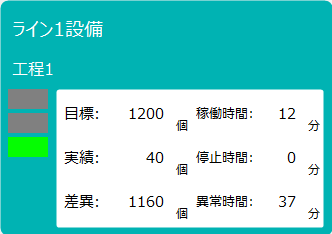
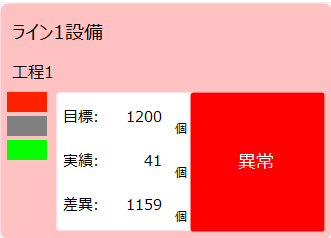
For example, Example 1 below displays production targets, actual results, and the number of variances, as well as operating hours, downtime, and abnormal times.
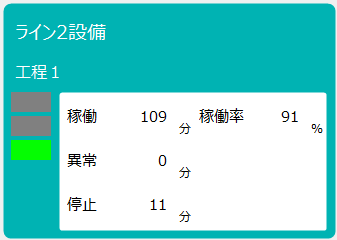
In Example 2, the operating time, abnormal time, and downtime as well as the operating rate are displayed.
In Example 3, only the number of times the equipment is on and off is displayed, and the left lamp also has a simple display with only two levels.
(Example 1) |
(Example 2) |
(Example 3) |
|
|
|
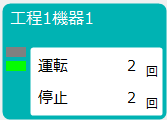
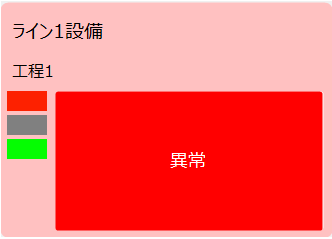
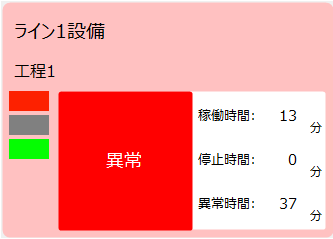
In addition, the center part of the display frame can be automatically switched to display a message depending on the equipment status. For example, in Example 4 below, it is used to display values under normal circumstances as shown on the left below, and in the event of an emergency such as a shutdown, a message is displayed in the center. In addition to displaying the message in the entire frame, it is also possible to use only the left half or only the right half for the message.
(Example 4: Normal times) |
(Message display: full screen) |
(Message display: Left only) |
(Message display: Right only) |
|
|
|
|
■About the layout of the operation status monitor
The display layout of the operation status monitor can be freely changed from the settings screen.
For example, Example 1 below is a basic layout example that displays all display frames at the same size.
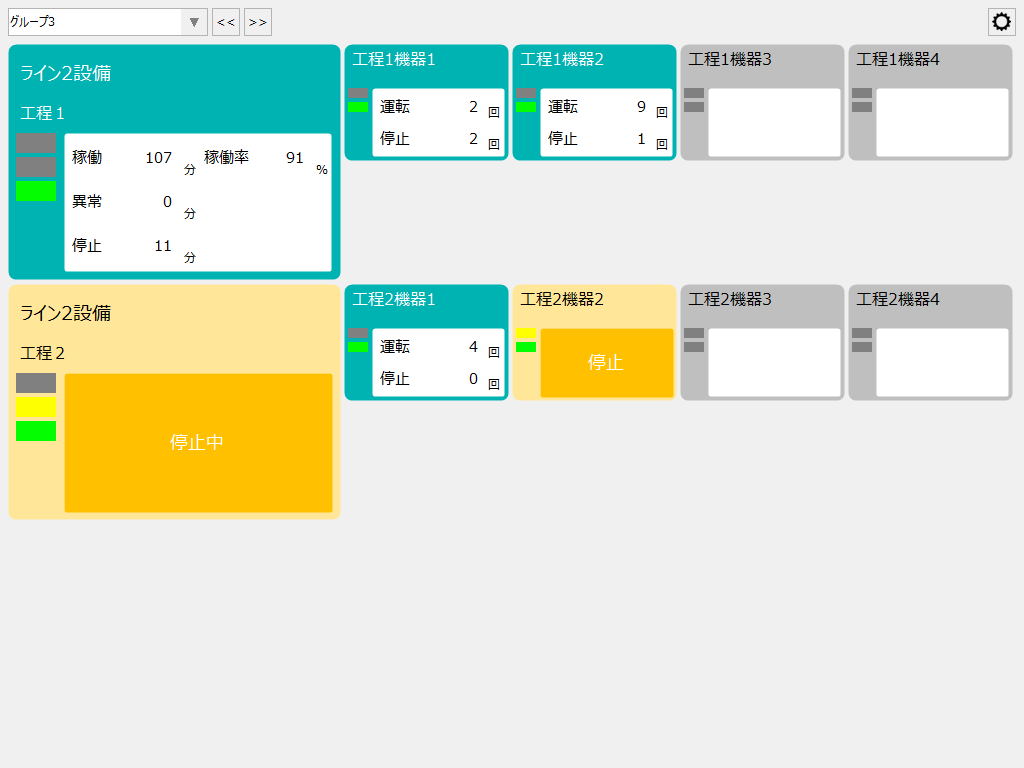
In the layout example in Example 2, by making the display frames different sizes through the merging settings, you can visually express the parent-child relationships of facilities and equipment.
(Example 1: All display frames are the same size)
(Example 2: Combining display frames of different display sizes)
Display of operation status history (daily)
The "Timeline Screen" and "Operation History Screen" allow you to view the operating status of monitored equipment, including operation, shutdown, abnormalities, and failures, on a daily basis.
■ Timeline (Gantt chart)
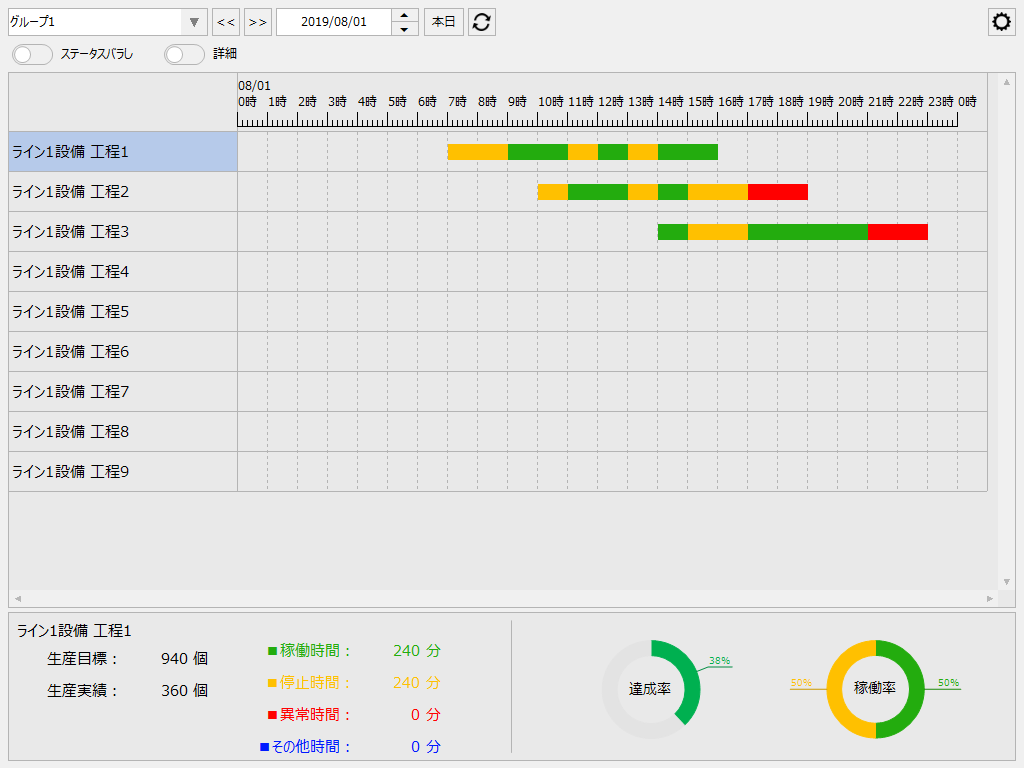
On the timeline screen, you can display the operation status of equipment, such as operation and shutdown, in a chronological Gantt chart. By selecting a group and date from the screen, the equipment in the target group will be displayed vertically, and the operation status (operation, shutdown, abnormality, etc.) for the date specified on the screen will be displayed in a color-coded manner.
In the normal display, a Gantt chart is displayed based on four types of aggregation classification: operating time, downtime, abnormal time, and other time.
(Timeline screen: normal display)
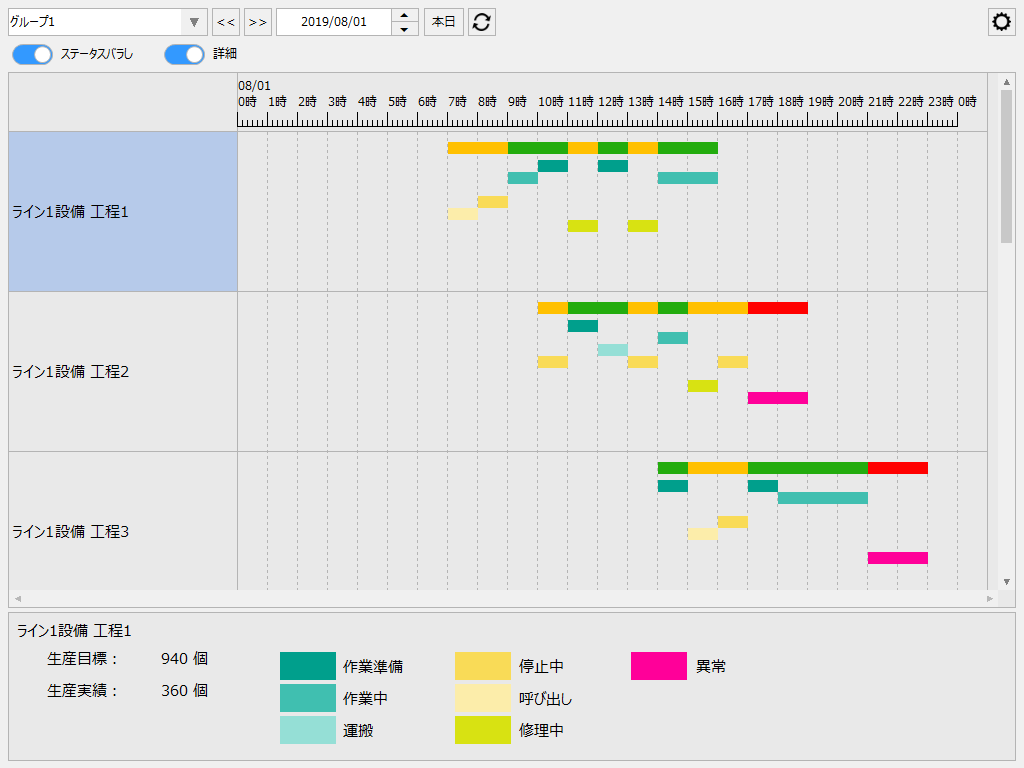
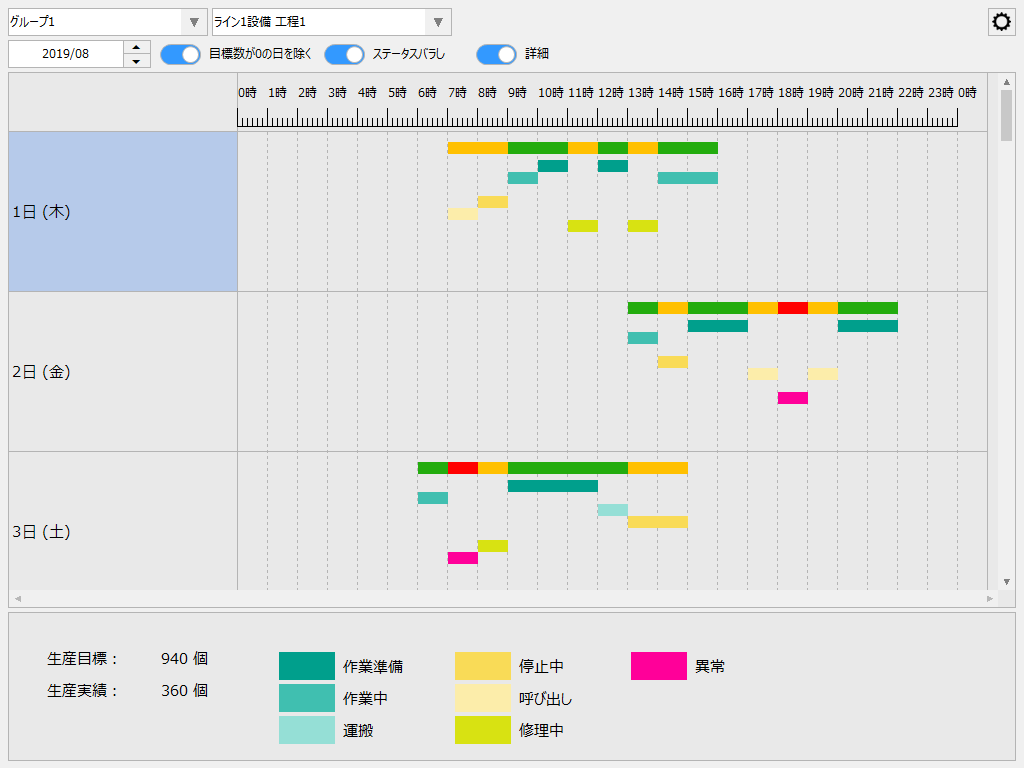
By turning on the detailed display, you can display a color-coded breakdown of each aggregate category.
(Timeline screen: detailed display example)
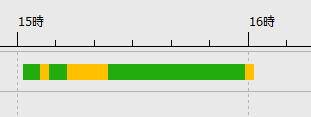
By default, 24 hours of data is displayed on one screen, but you can enlarge the displayed data by dragging the time portion of the timeline with the mouse.
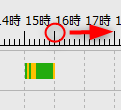
(Enlarged display example)
■ Operational performance screen (list display)
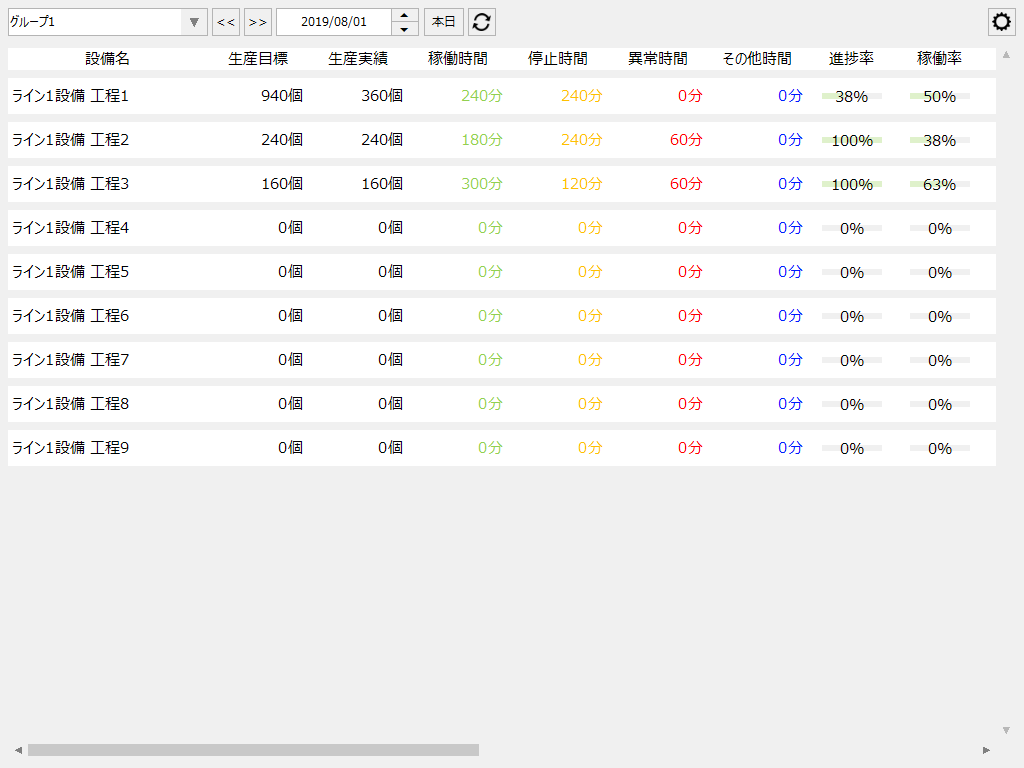
The operation results screen can display the operation results of equipment in a list format. By selecting any group and date from the screen, you can display the aggregated values such as operation time, stop time, operation count, stop count, and abnormality count, operation rate, production target, production results, progress rate, etc. of the equipment in the target group in a list format.
(Operation results screen)
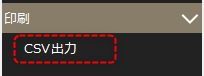
By selecting CSV output from the menu, the currently displayed data can be saved to a CSV file.
Display of operation status history (monthly)
The "Monthly Report Timeline Screen" and "Monthly Report Operation Results Screen" allow you to view the operating status of monitored equipment, including operation, shutdown, abnormalities, and failures, on a monthly basis.
■Monthly report timeline (Gantt chart)
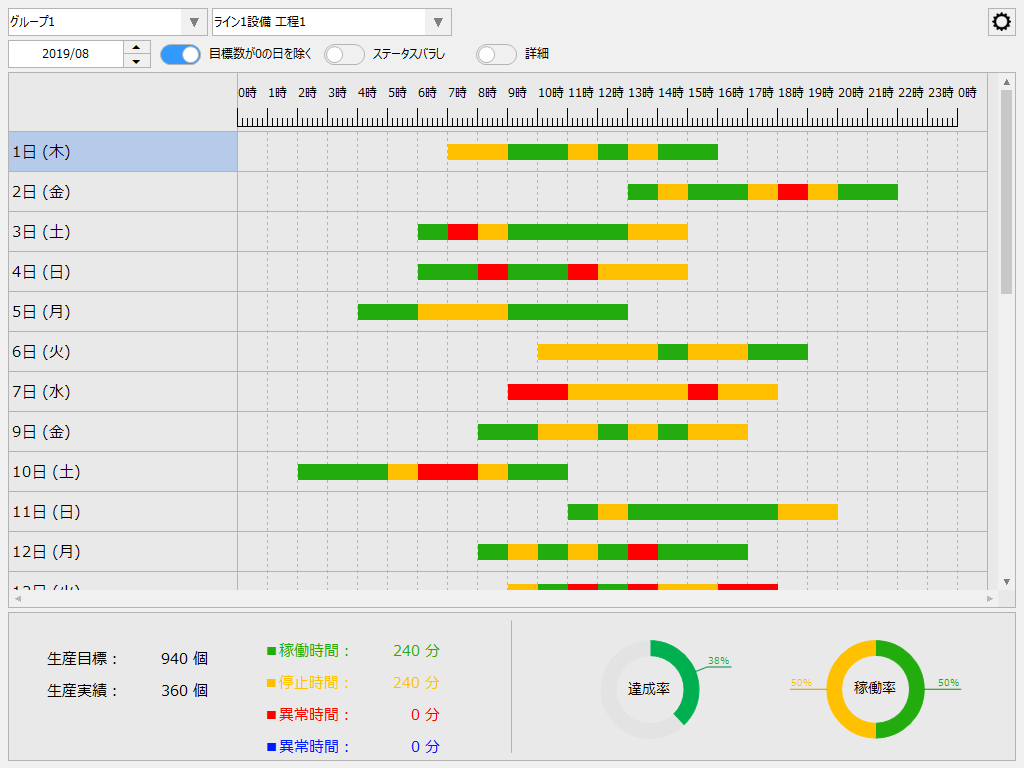
The Monthly Report Timeline screen is a screen for displaying the operation status of the equipment selected from the screen for one month in a Gantt chart. The operation status such as operation time and stop time for the year and month selected from the screen is displayed as a Gantt chart with one line per day for one month.
In the normal display, a Gantt chart is displayed based on four types of aggregation classification: operating time, downtime, abnormal time, and other time.
(Monthly report timeline screen: normal display)
By turning on the detailed display, you can display a color-coded breakdown of each aggregate category.
(Monthly report timeline screen: detailed display example)
■Monthly operation results screen (report display)
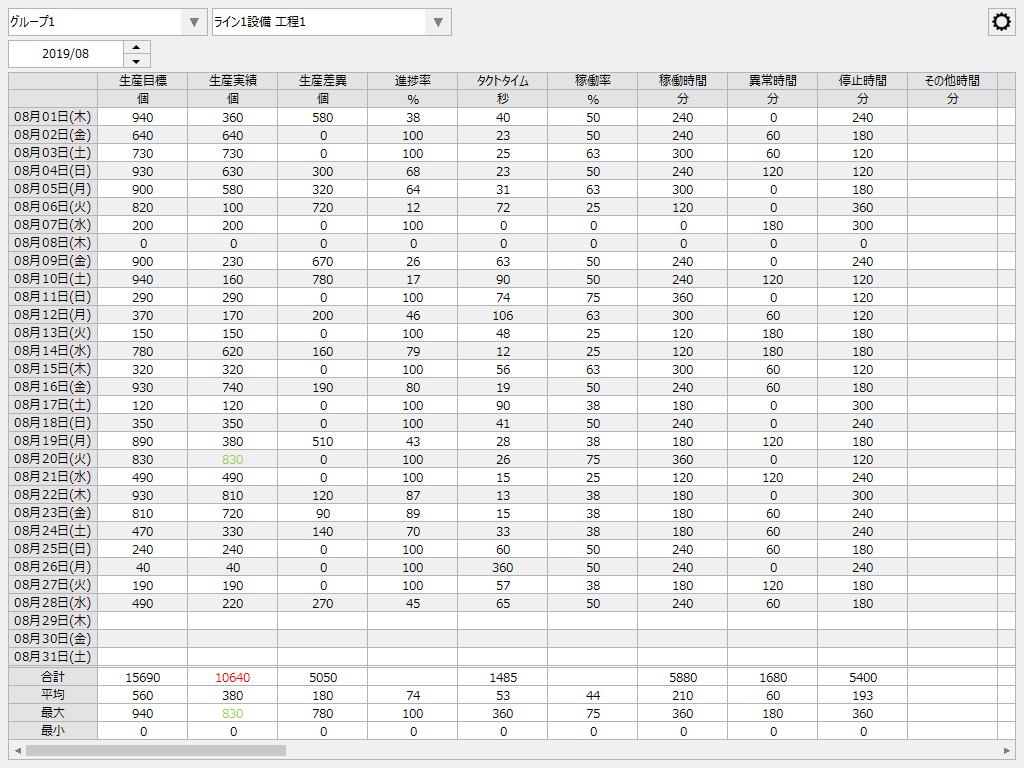
The monthly operation results screen is a monthly report screen for the operation results of equipment. The aggregated daily operation status values for the year and month selected on the screen are displayed on a grid.
(Monthly operation results screen)
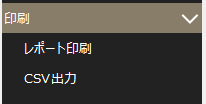
The currently displayed monthly report data can be printed or saved to a CSV file.
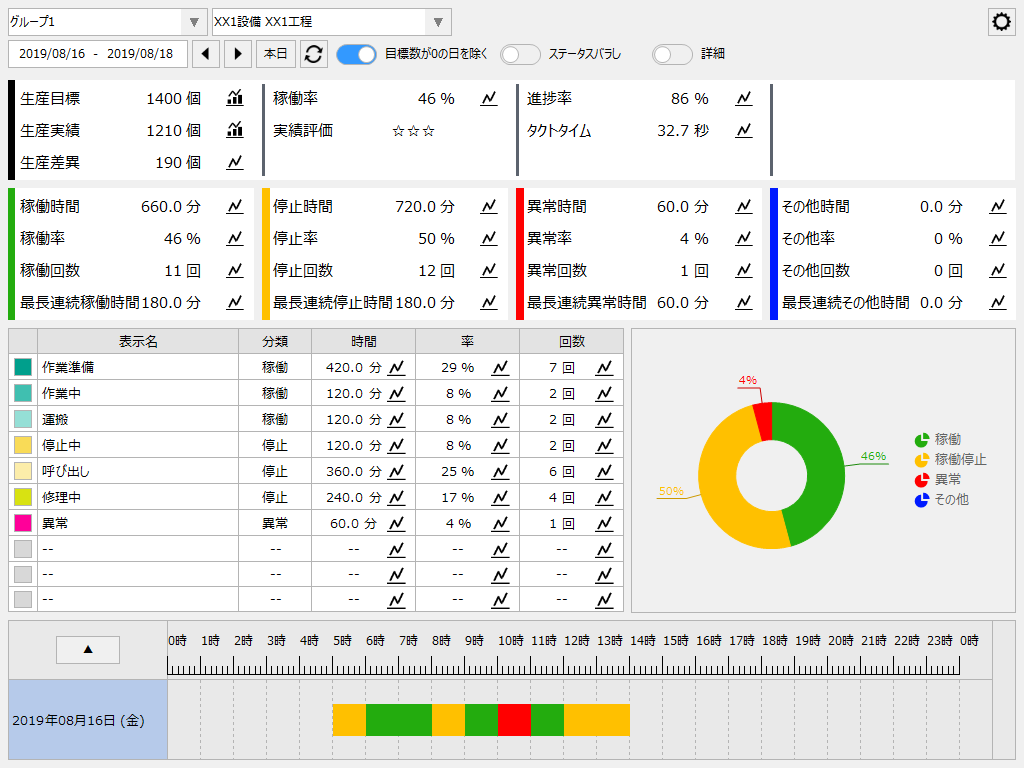
The operation analysis screen allows you to view detailed operation data for equipment.
You can select any date and equipment from the screen to display the operation time, stop time, and other time aggregates for the equipment, detailed breakdown of each time aggregate, operation count, stop count, and abnormality count aggregates, operation rate, etc. You can also display production targets, production results, production variances, progress rates, and takt times by setting production targets and production result collection.
(Operation analysis screen)
■ Specifying a date range
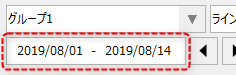
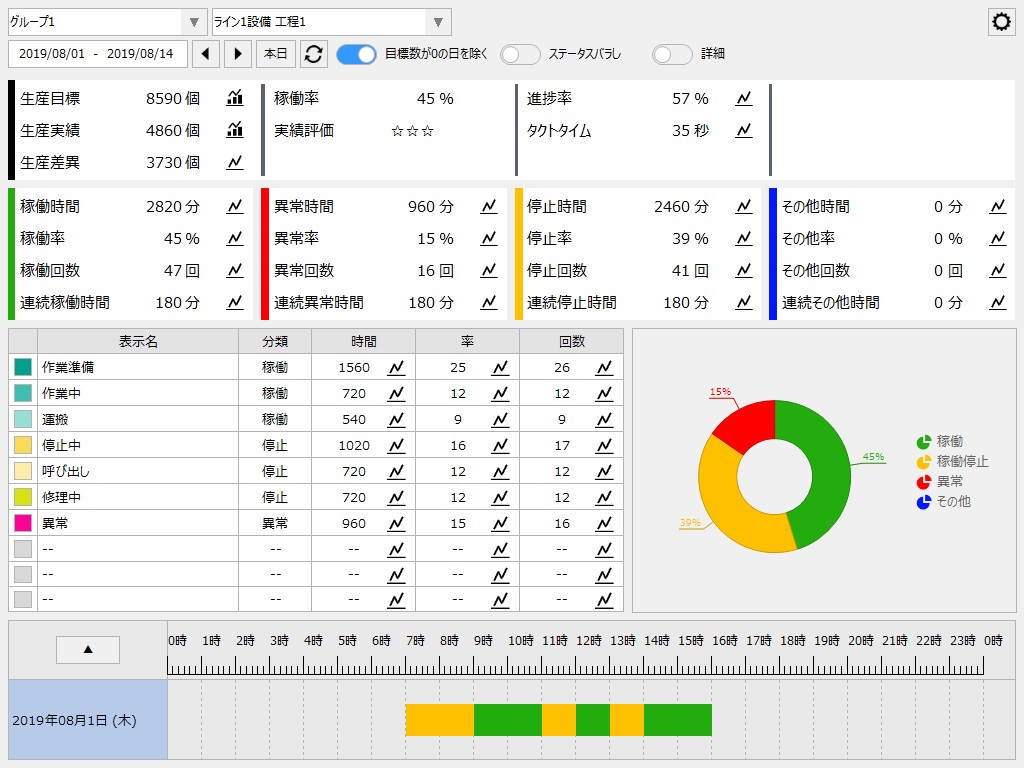
On the operation analysis screen, it is possible to specify a range of multiple dates to display, and data for the specified date range can be aggregated and displayed.
(Date range specification)
(Example of specifying multiple dates)
■ Calling up graph display
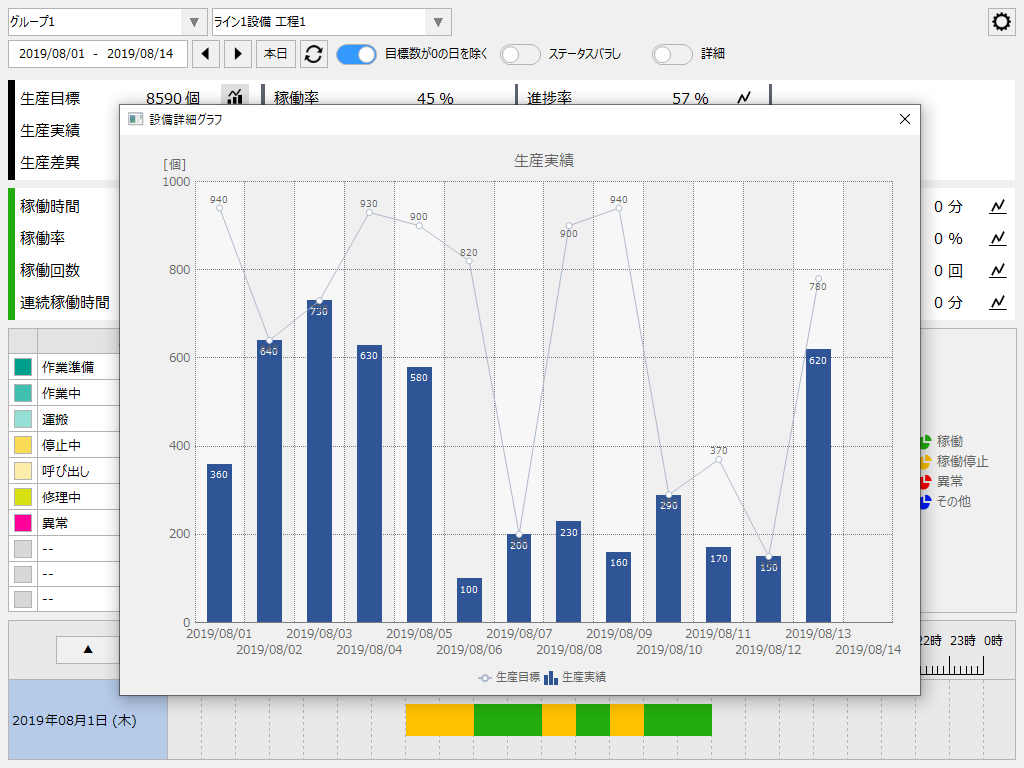
The following icons are located next to each data item on the operation analysis screen.
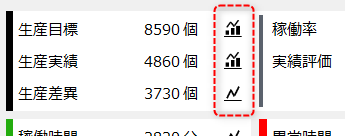
Clicking on the icon above will open a pop-up window with a graph of the selected data for the currently displayed time period.
(Graph display example)
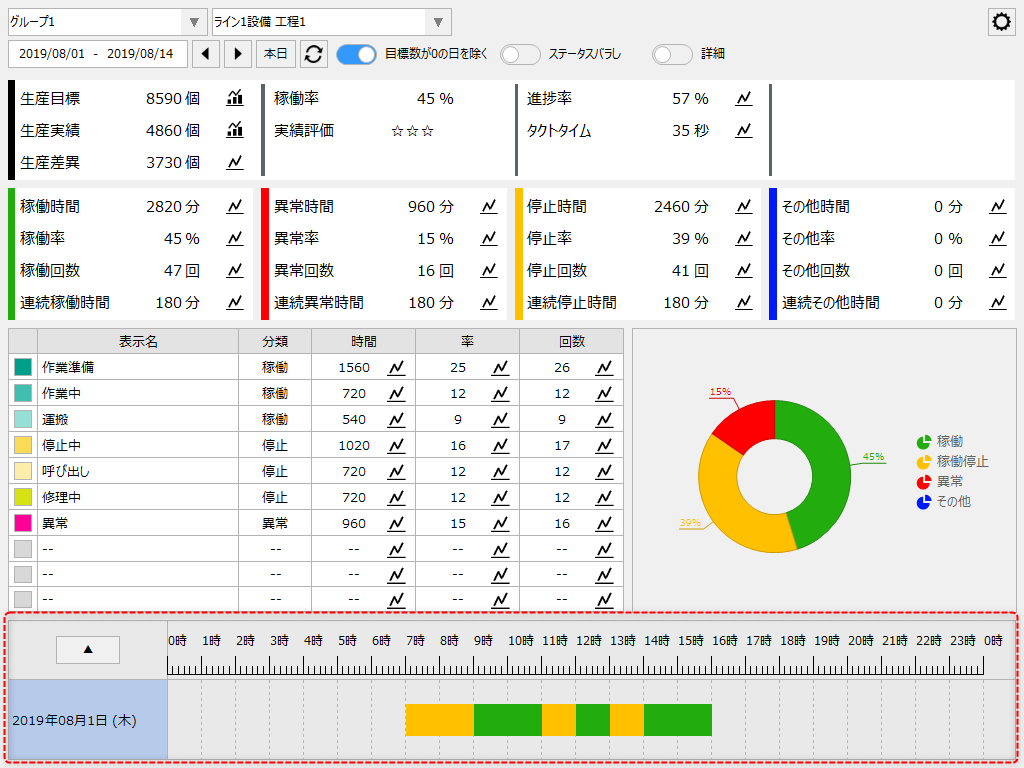
■ Gantt chart display
The Gantt chart for the target facility is displayed at the bottom of the screen. Normally, the chart for the first date of the selected date range is displayed in one row.
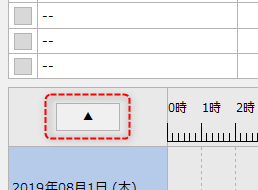
By clicking the button below at the bottom of the screen, you can hide the detailed display at the top of the screen and switch to Gantt chart display only.
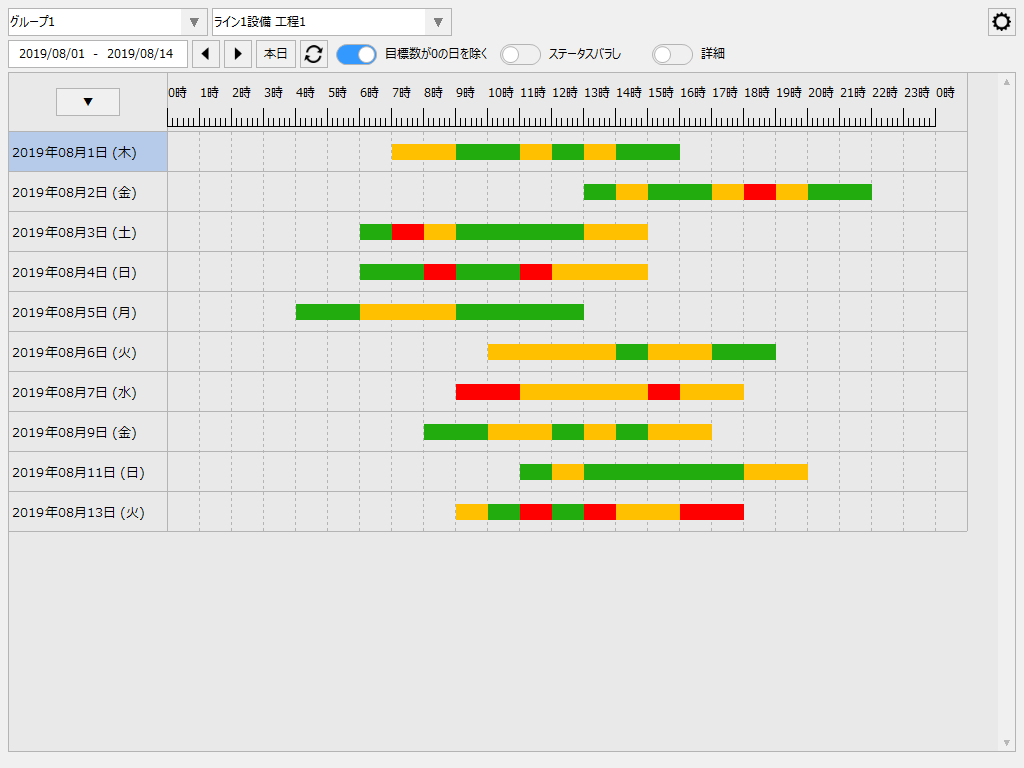
In particular, when you select a range of data for multiple dates and display it, the Gantt charts for all dates in the currently selected display period are displayed vertically on a daily basis. This function allows you to compare daily operation conditions side by side.
(Example of multi-date Gantt chart display)
Analysis by graphs (bar graphs/layered graphs)
The "Monthly Bar Graph Screen" and "Monthly Stacked Graph Screen" are available as tools for analyzing operation status. Using these graph screens, you can analyze the monthly operation status of the target equipment.
■Monthly bar graph
The Monthly Report Bar Graph screen displays the equipment operation results as a bar graph on a monthly basis. The aggregated values of the operation status for the year and month selected on the screen are displayed in up to three bar graph series.
(Monthly report bar graph screen)
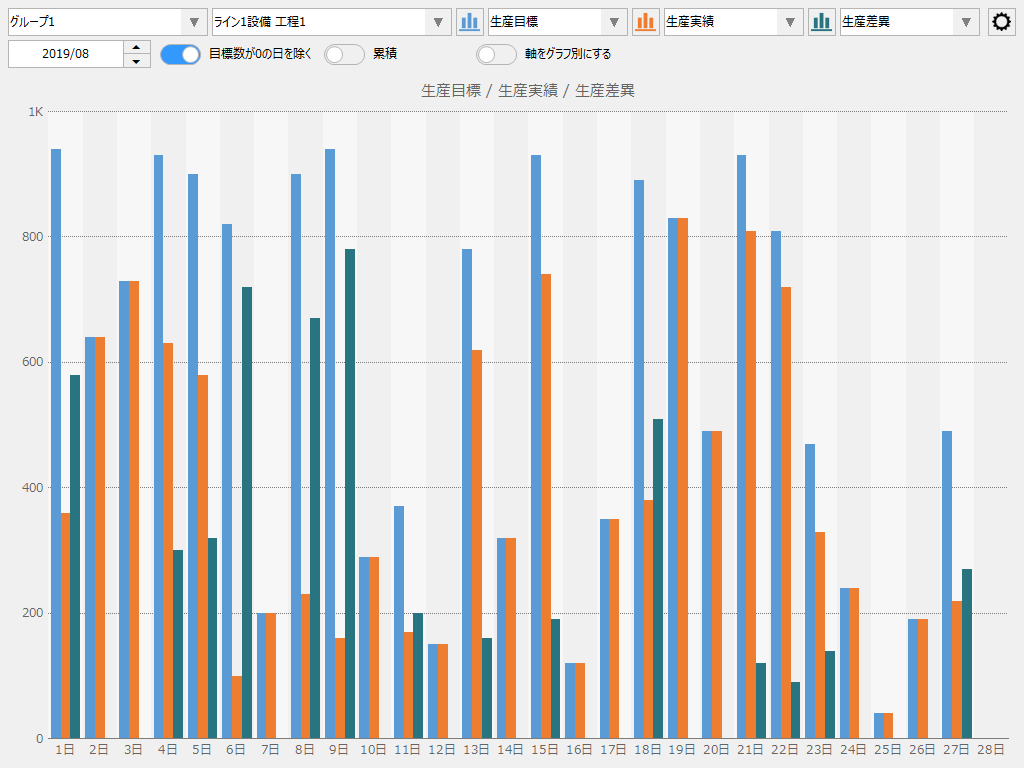
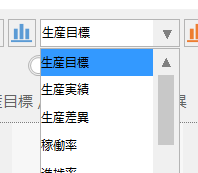
The data to be displayed in each series of the graph can be freely selected from various aggregated data such as production targets, production results, operation times, and stop times.
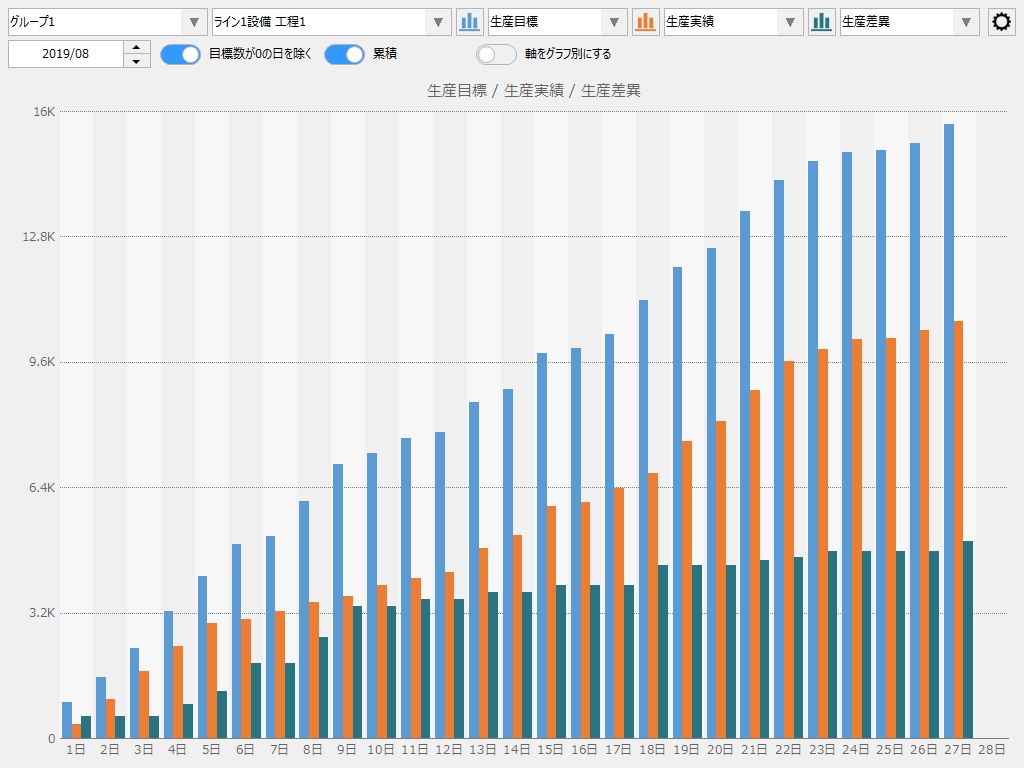
By displaying the cumulative totals on the graph, you can display the cumulative totals for the currently displayed month on the graph. This is useful when you want to check the progress of production targets and actual production results, or the trends in monthly production results.
(Monthly report bar graph screen: cumulative total display example)
■Monthly stacked graph
The monthly stacked graph screen displays the equipment operation status as a stacked graph on a monthly basis. For the year and month selected on the screen, the operation time, stop time, abnormal time, and other time for the equipment are displayed in a stacked graph.
(Monthly report stacked graph screen)
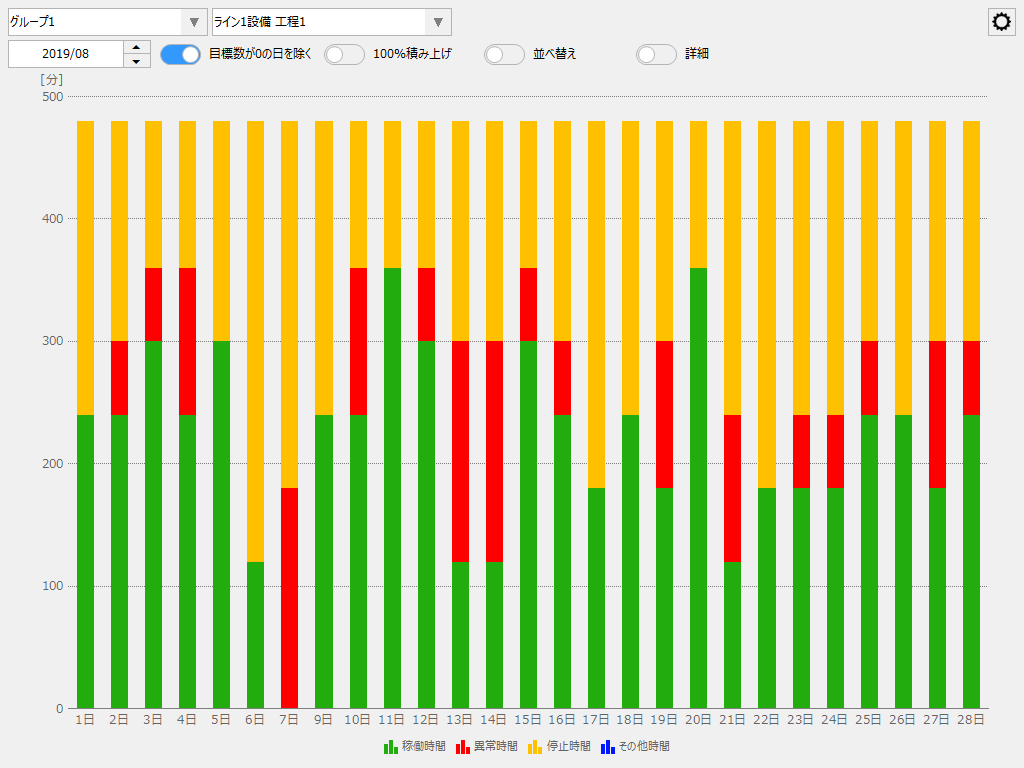
By clicking on the legend at the bottom of the screen, you can toggle between showing and hiding each series in the graph.

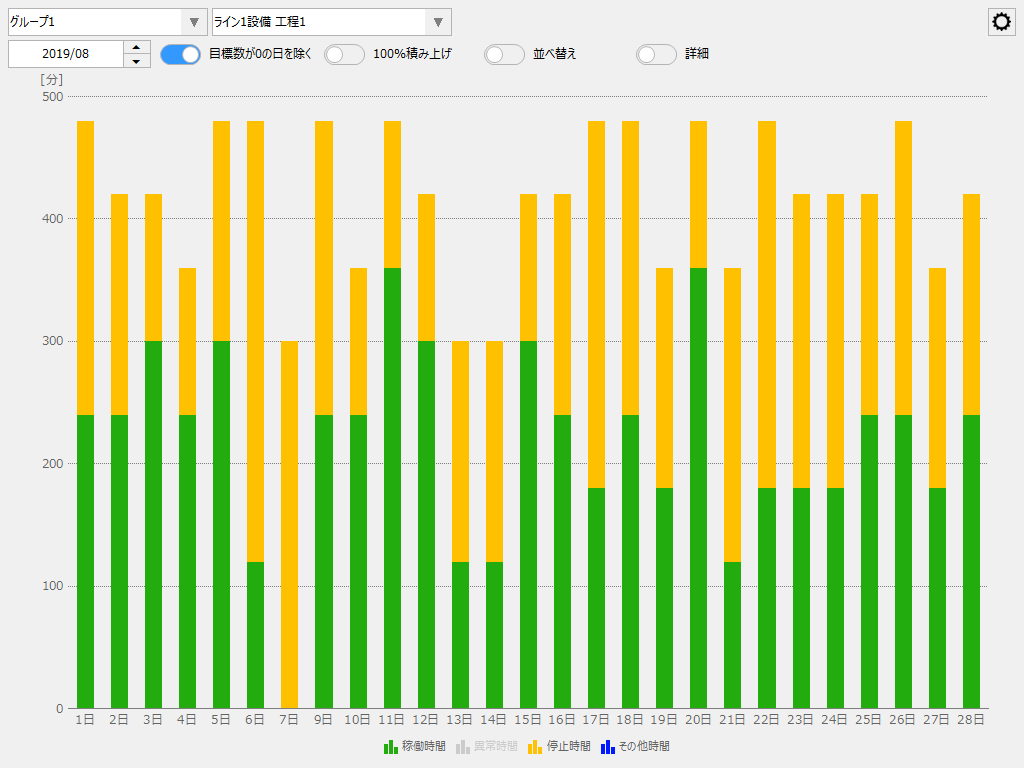
Below is an example where abnormal times are hidden.
(Monthly report stacked graph screen: Example of abnormal times not displayed)
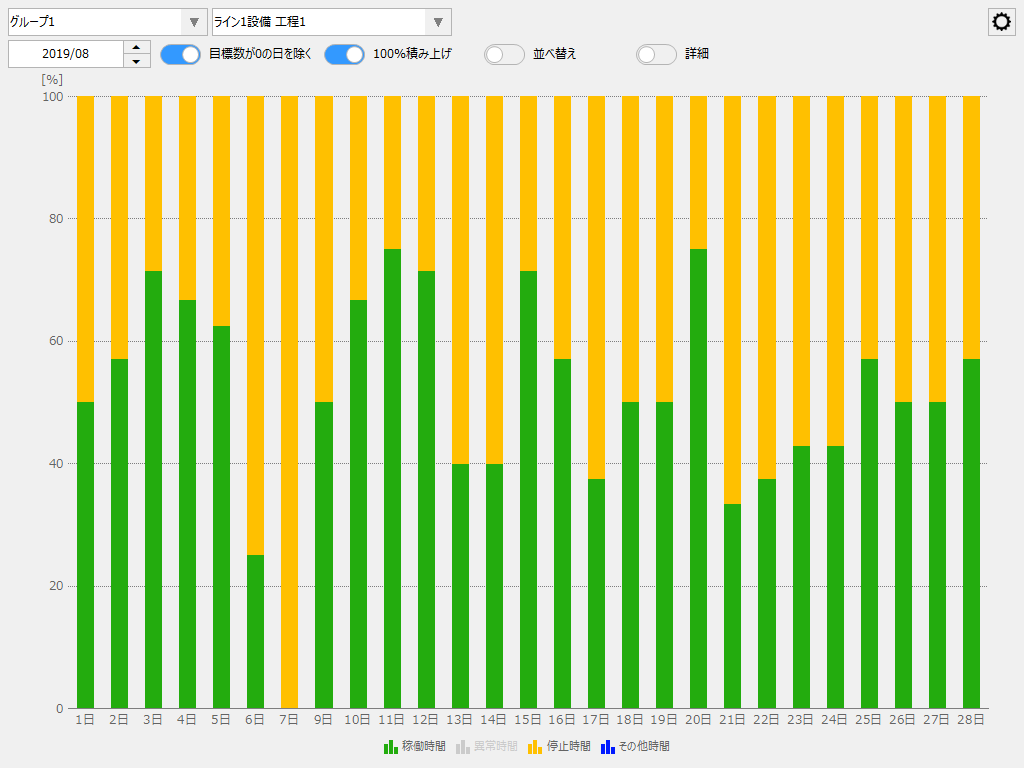
Enabling 100% stacking allows you to display a stacked chart that uses 100% of the chart's height.
The following is an example of 100% stacked display with abnormal times hidden.
(Monthly report stacked graph screen: Example of 100% stacked display)
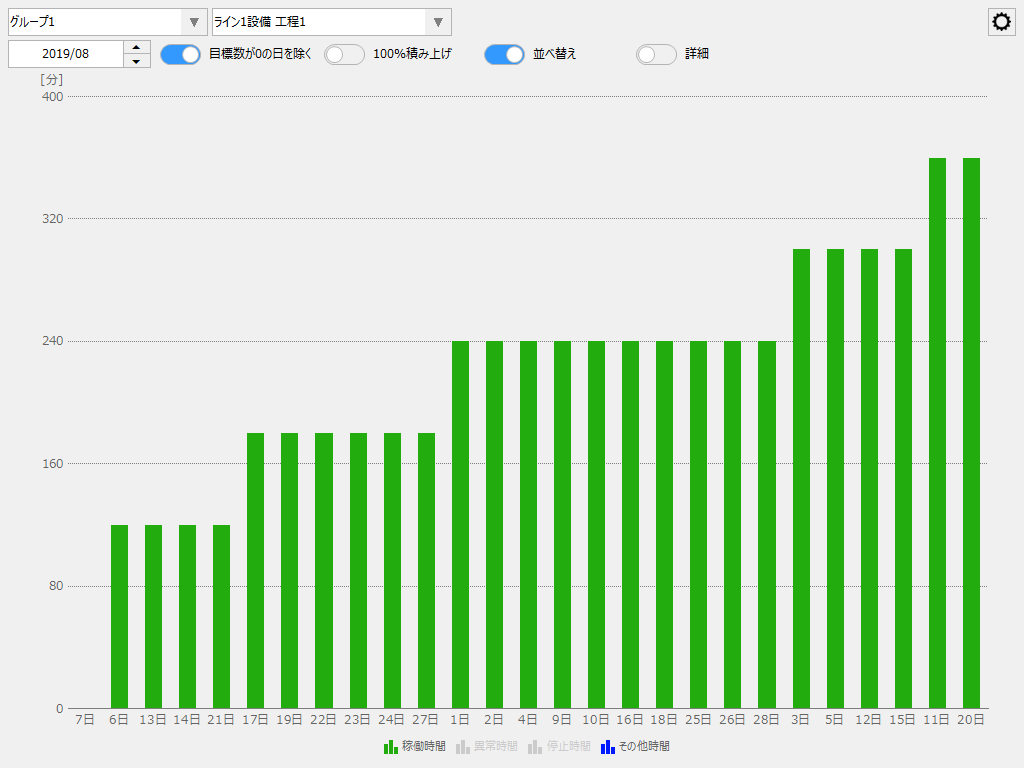
By enabling sorting, you can switch the graph display to ascending order of data instead of date order. By sorting by data order, you can see the ranking of operating hours and abnormal hours.
Below is an example of sorting by showing only working hours.
(Monthly report stacked graph screen: example of sorting display)