Related information selection operations
You can select related information from the "Information Bar".
The information bar can usually be displayed by clicking the following icon in the top right corner of the screen.
When any data such as a tag or alarm is selected on a main area screen, such as a signal list, trend graph, or alarm summary, the information is displayed in the "Next candidate" field on the information bar.
(Example of selection from the signal list screen)
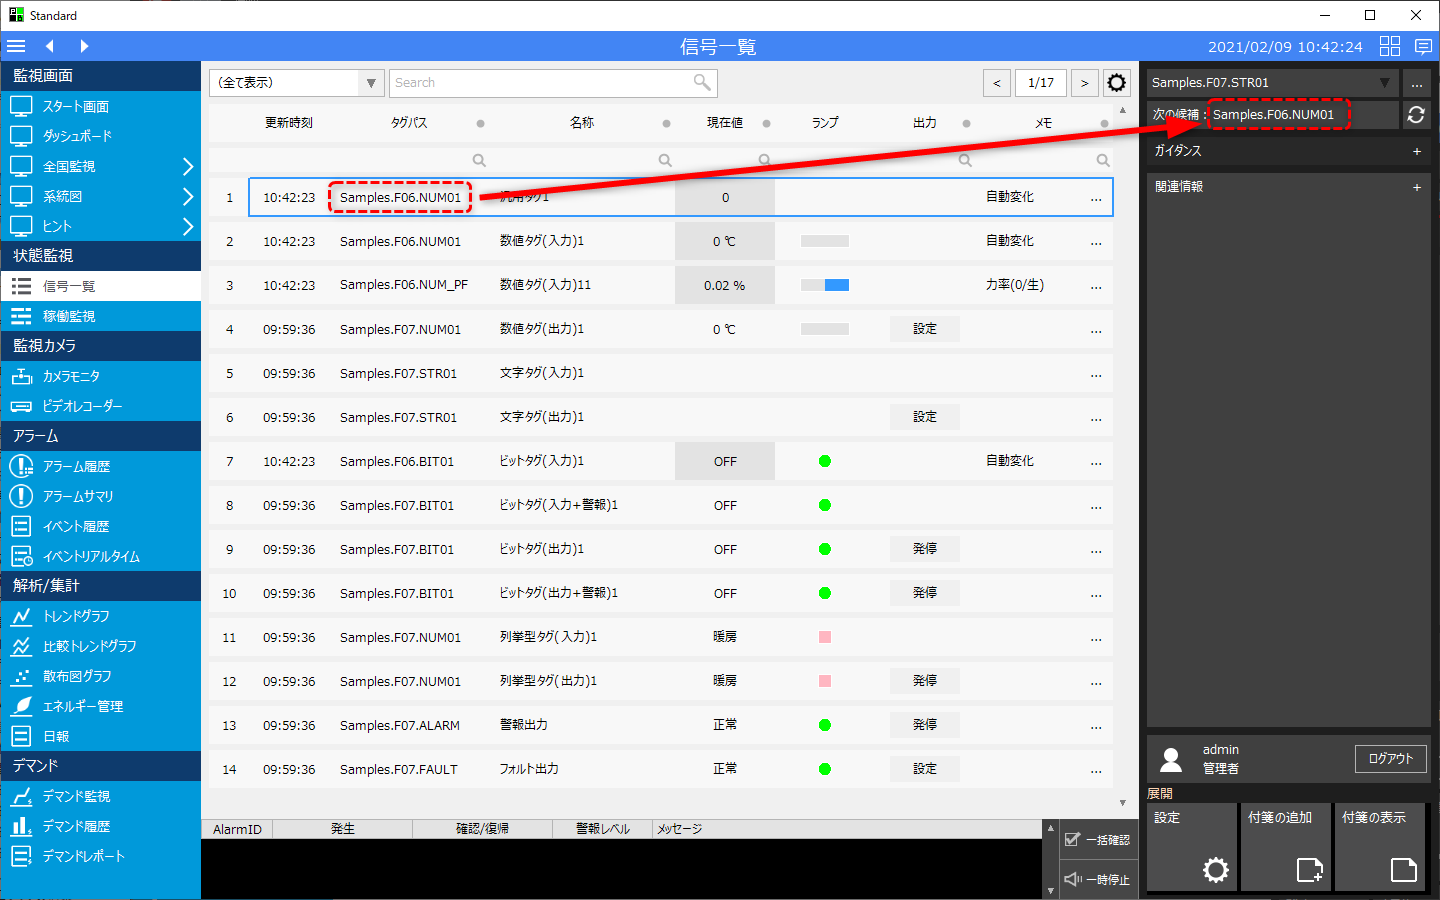
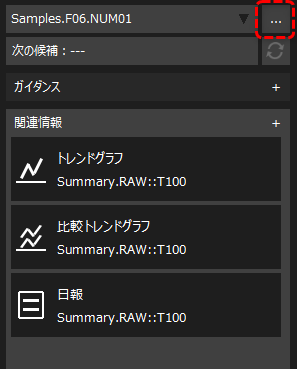
(Enlarged image of the information bar)
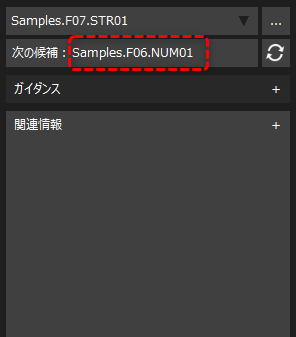
In this state, click the refresh icon to the right of the candidate.
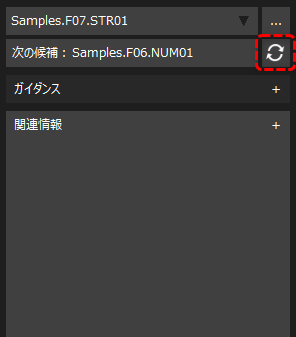
This will update the currently selected information. If there is related information, it will be displayed in a list as shown below.
|
The contents of this list change depending on the information selected.
For example, if this tag is registered to a summary action, the trend graph, comparative trend graph, and daily report screens will be displayed as candidates, or if the tag is registered to an alarm, the alarm summary and alarm history screens will be displayed as further candidates.
|
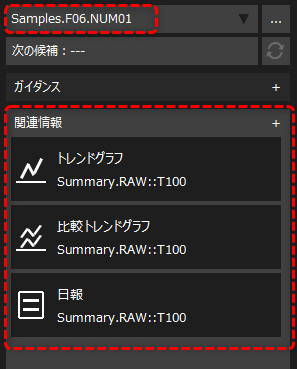
When you click on the desired function from the list of related information, the display will switch to the screen for that function. At this point, the screen you are viewing will automatically open with the content related to the currently selected information displayed. For example, if it is a trend graph, the pen for the relevant information will be displayed, and if it is a daily report, the page where the relevant data source is registered will be opened.
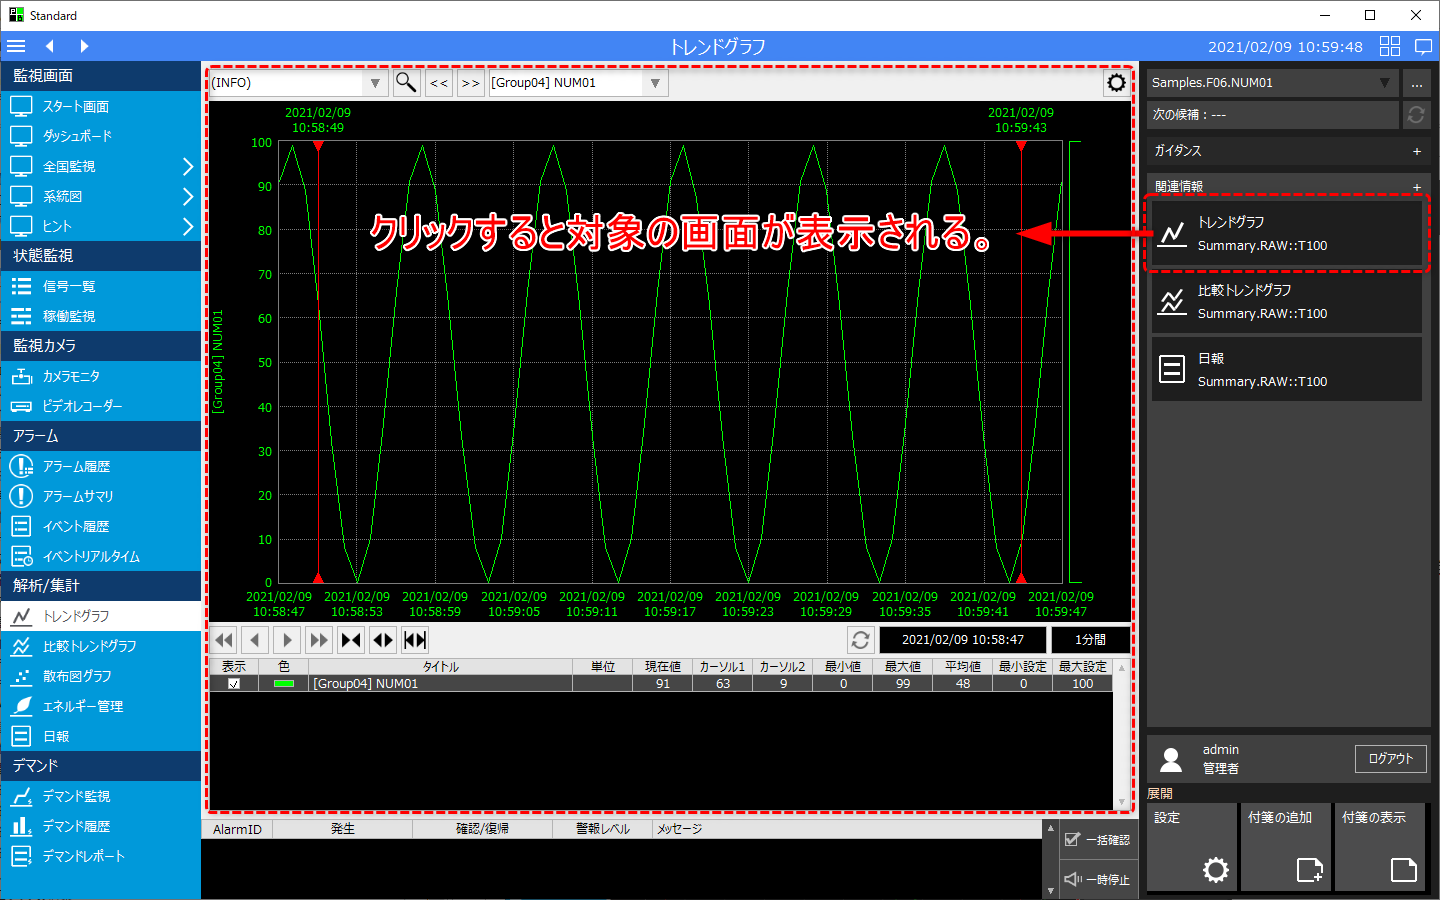
In this way, the related information function makes it easy to dig deeper and investigate various related information. For example, you can view trend graphs related to the time of occurrence from the alarm history, or view trend graphs of aggregated dates and times from the daily report grid to investigate the details.
|
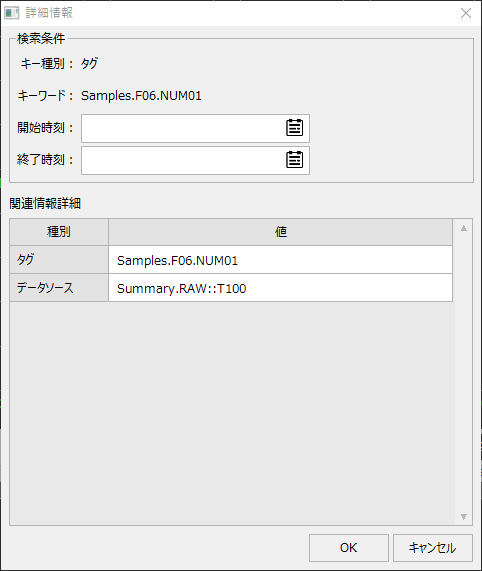
Clicking the icon on the left from the information bar will display a pop-up with details of the currently selected related information.
|
(Detailed Information Dialog)
|
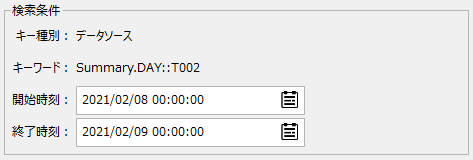
The content displayed in the detailed information changes depending on the information currently selected. For example, if the grid on the daily report screen is selected, the aggregation period (start/end time of aggregation) for the corresponding daily report data will be set. When trend graphs and other historical data are displayed from related information, they will be displayed based on this time.
(Example where start/end times are set)
|