Experience a demonstration sample
Thank you for using FA-Panel.
This page describes how to run a sample standard project. By actually running the sample, you can get an overview of the various functions provided by this product.
Running the demonstration sample
1.Please refer to "Installation" to install FA-Panel.
2.From the Windows start menu, select "Roboticsware-FA-Panel6-Editor." This will launch the application for creating screens (this application is called Panel Editor).
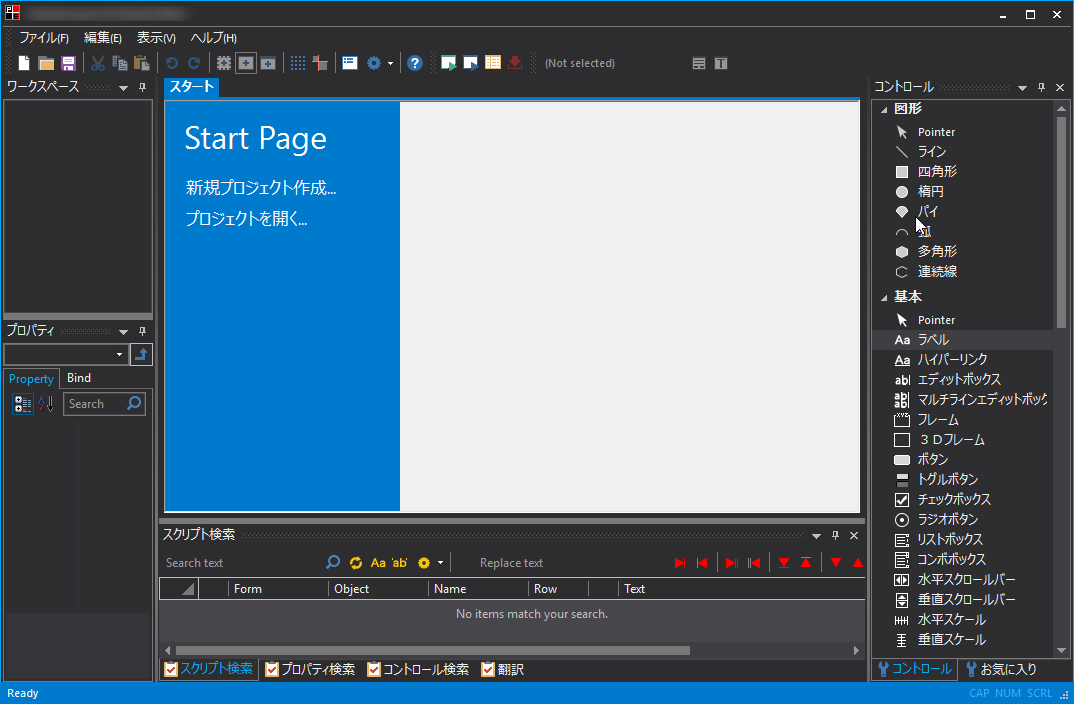
3.Click "Create a new project" in the area displayed in the center of the screen, and then click "Standard Framework" on the right. Explanations will be displayed at the bottom, so click the "Sample" button there.
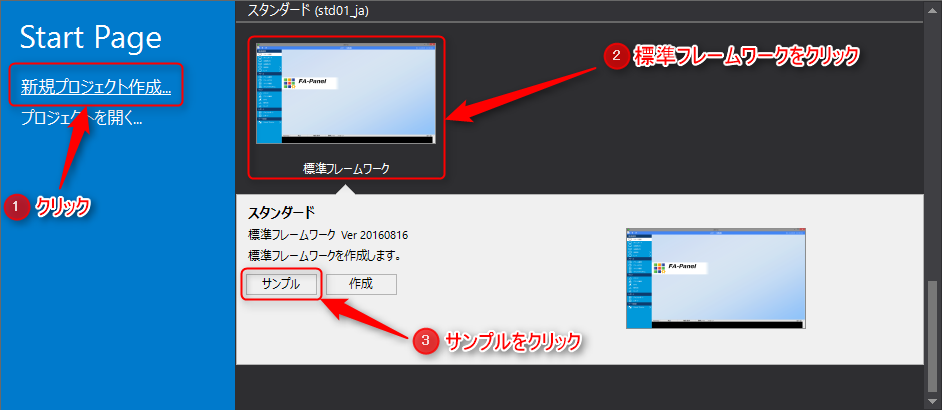
Then, a sample program for demonstration will open as shown below.
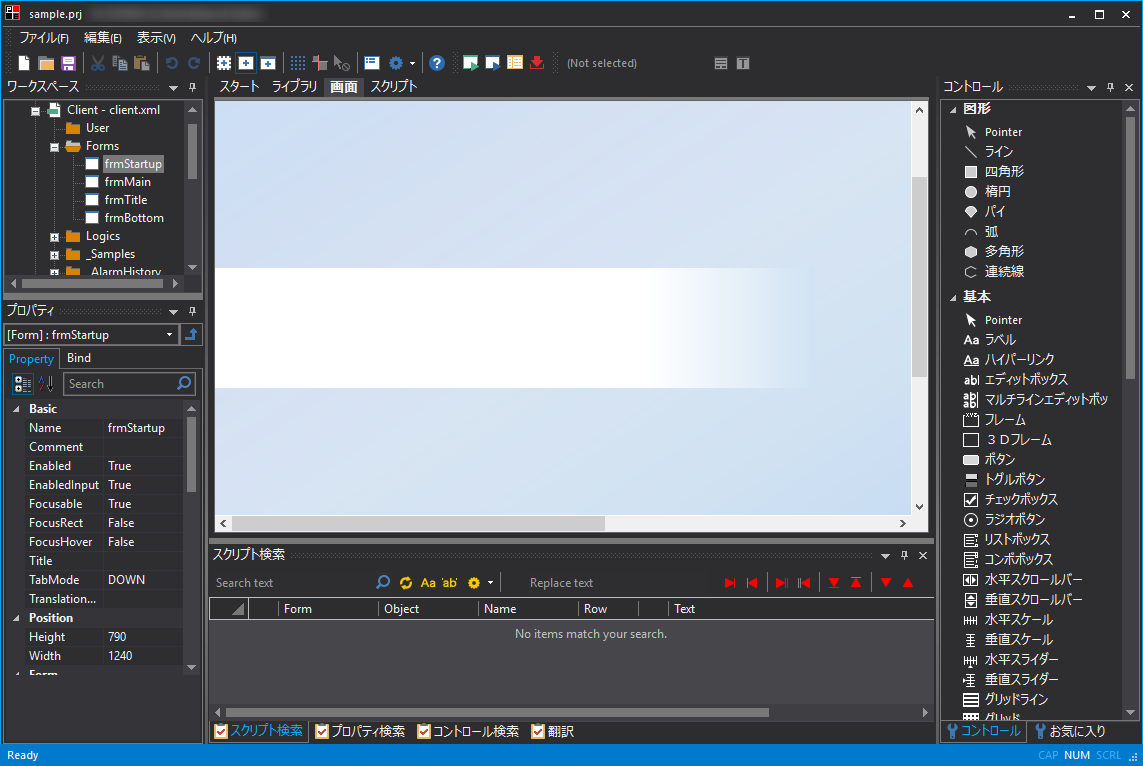
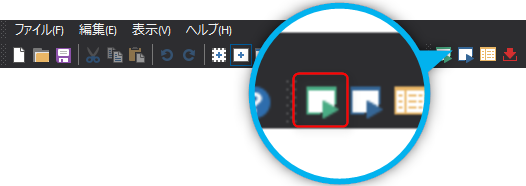
4.Next, click on the blue arrow icon at the top of the screen:
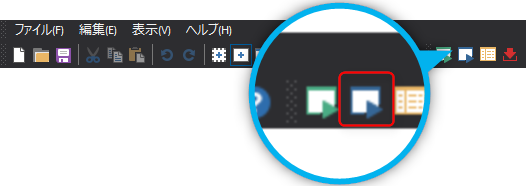
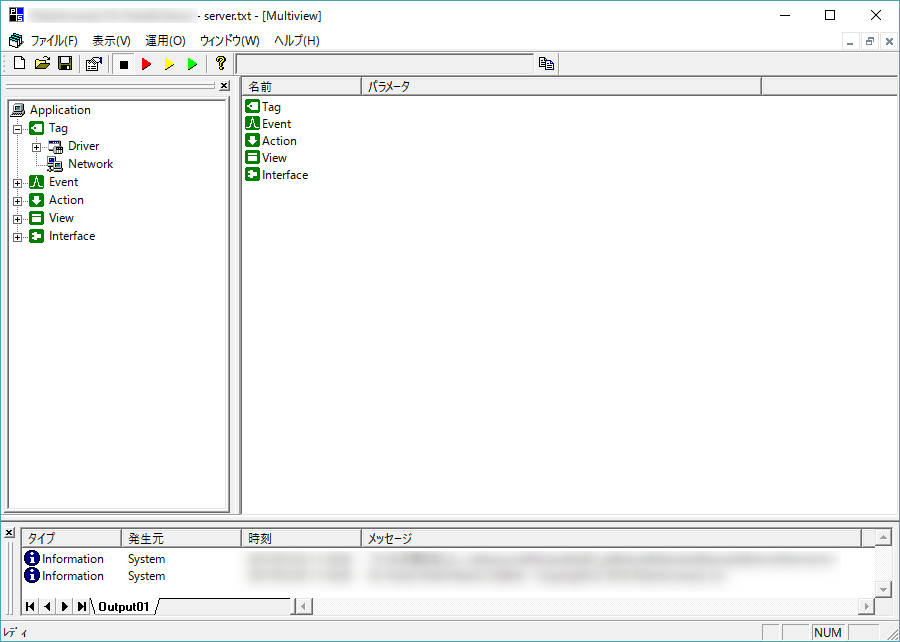
This will start a server application to communicate with PLC, perform logging, etc. (This application is called Panel Server).
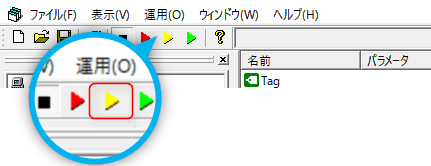
5.Click the "yellow arrow" icon at the top of the Panel Server screen (this action is called "Online").
6.Return to Panel Editor and click on the "green arrow" icon at the top of the screen:
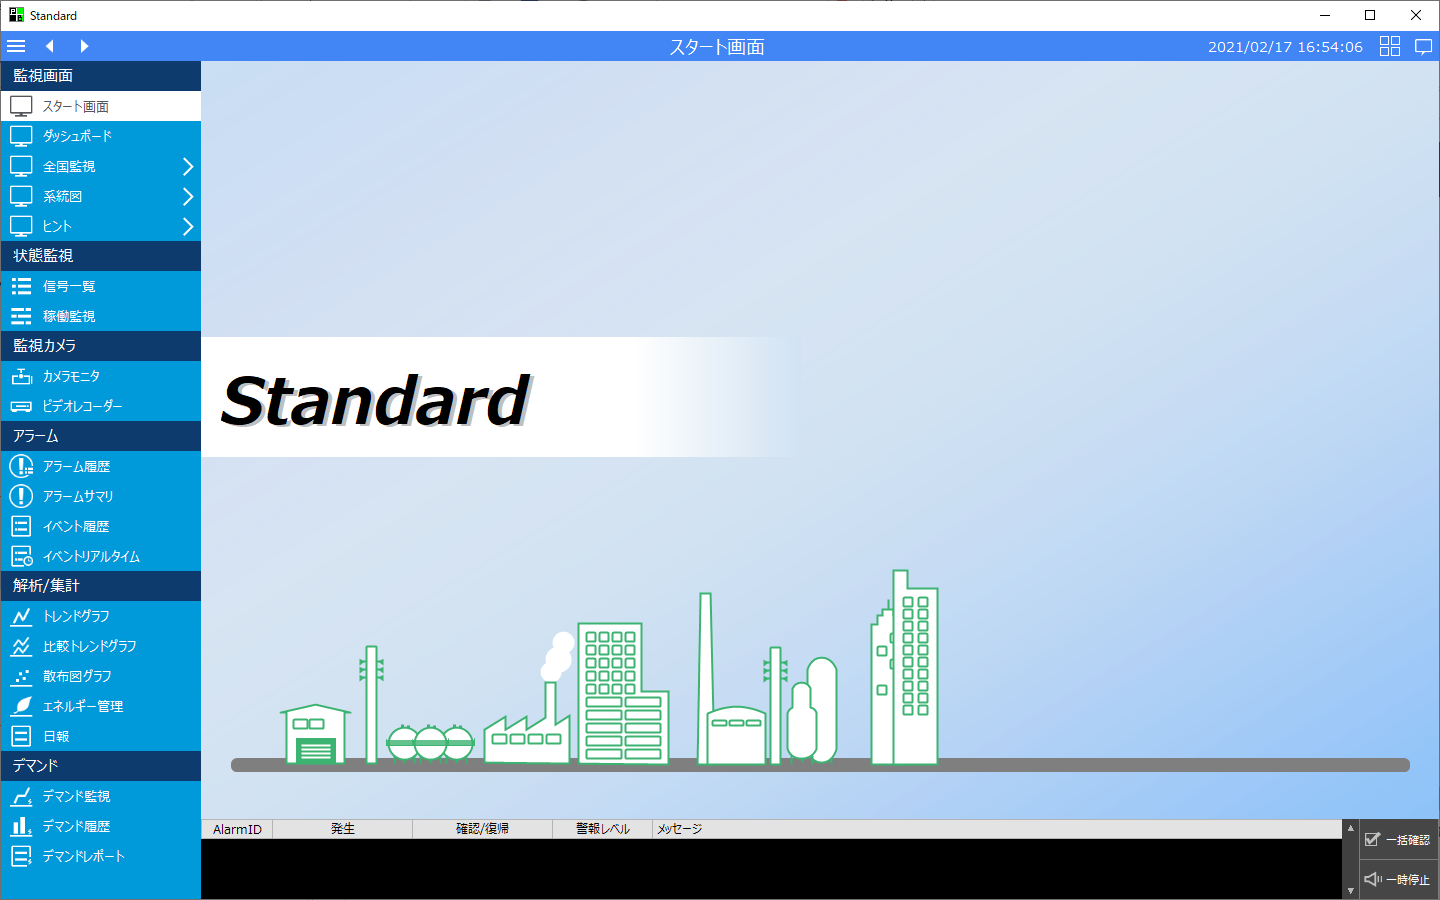
Then, Panel Browser will start and a sample screen like the one below will be displayed.
Demonstration sample operation
Please try out the various functions that this package provides as standard by touching the actual demonstration sample screen. The demonstration sample also includes sample data. By specifying sample data for the date and time of historical data, you can display the data on the graph screen.
Below are the steps for demoing each sample screen.
Screen Name |
Screen image |
Demo Steps |
||||||
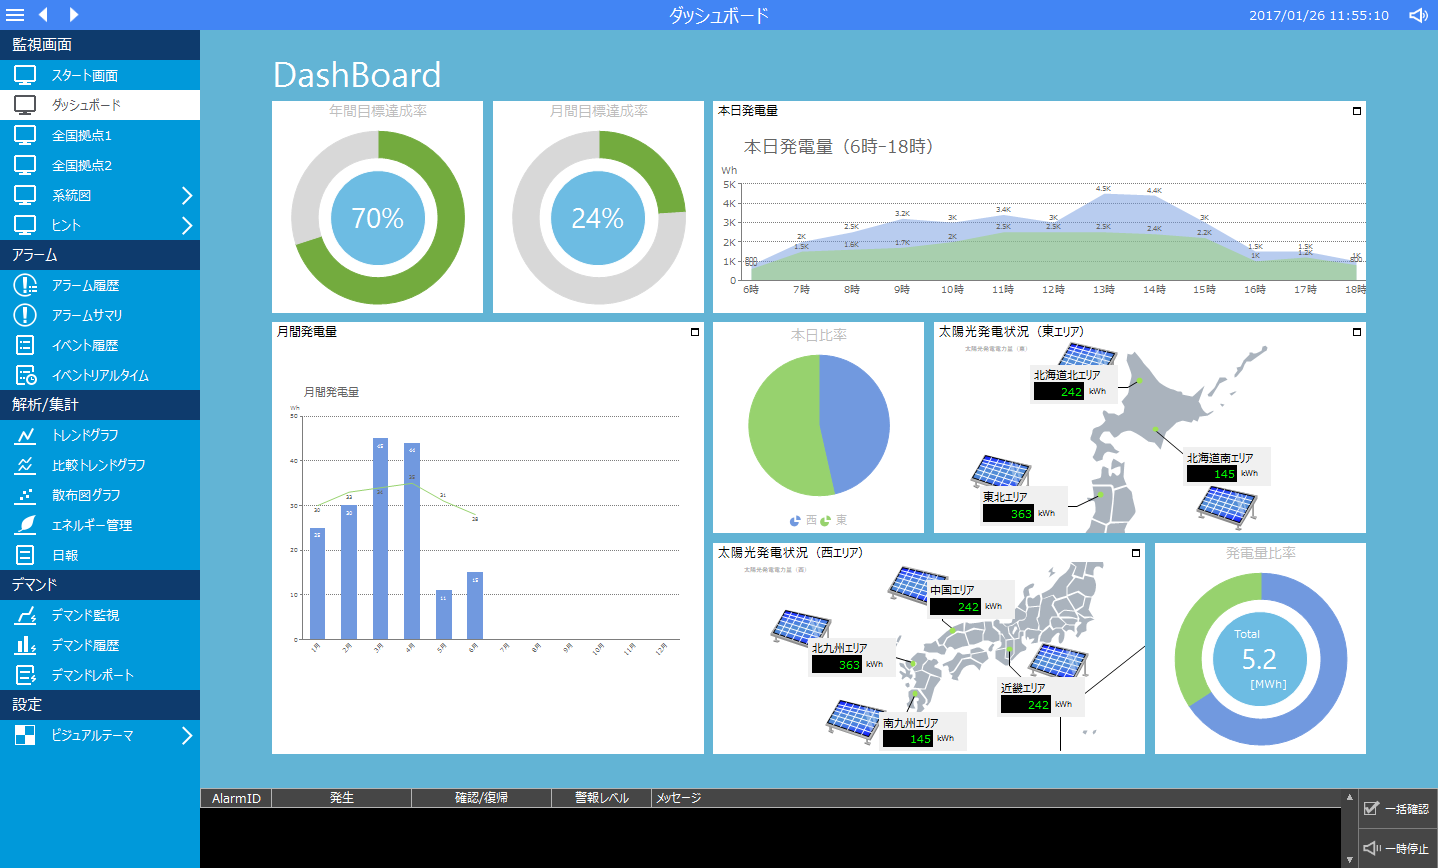
Dashboard (Screen creation example) |
|
•This is an example of a screen that mimics a dashboard. •Graphs and other images are display samples (the data will not change). •You can place multiple screens (views) on one screen. •Click the button in the red frame below to enlarge the corresponding screen.  |
||||||
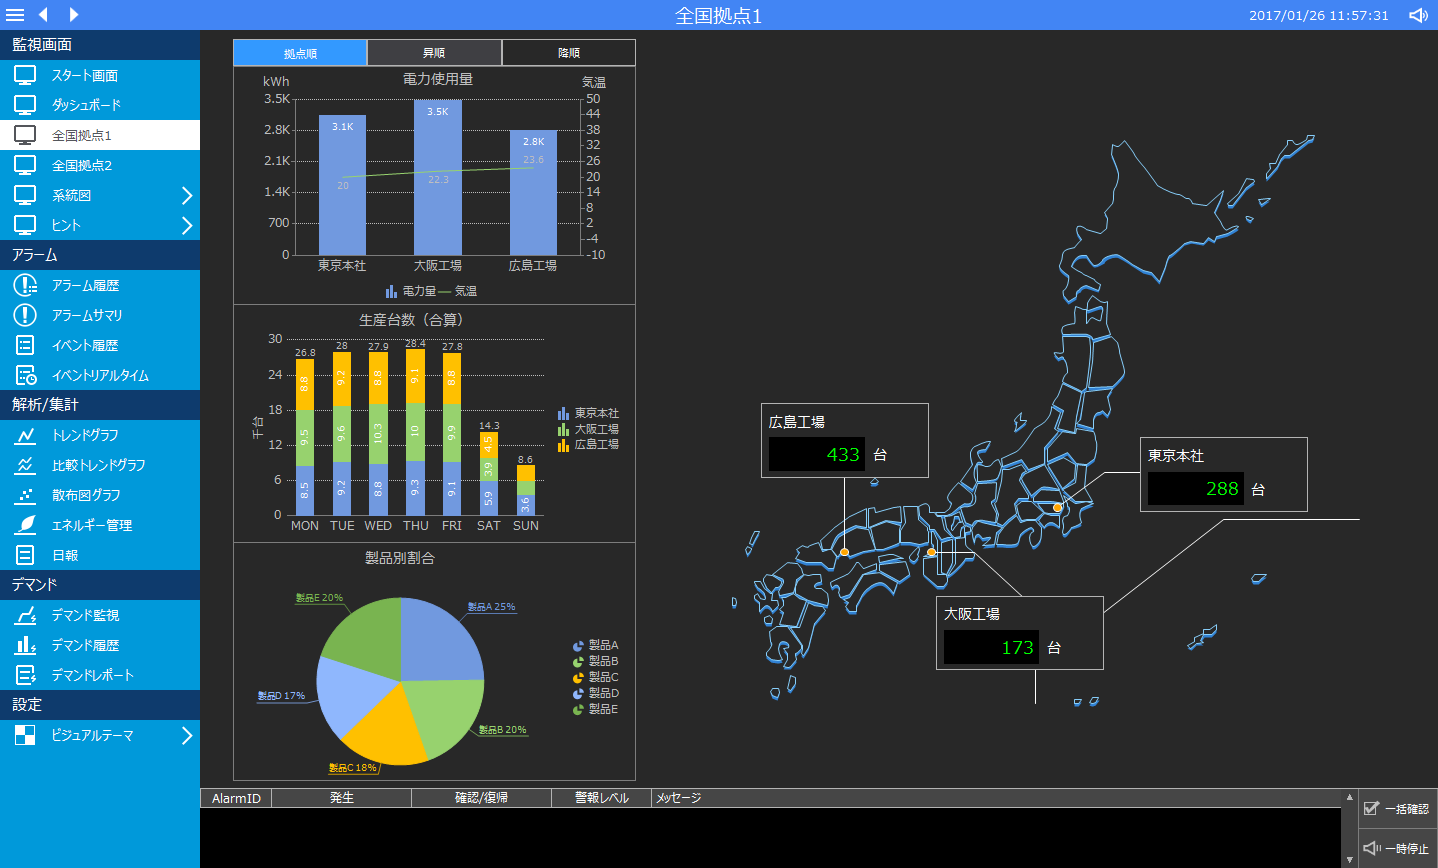
Nationwide base 1 (Screen creation example) |
|
•This is an example of a screen that simulates nationwide surveillance. •Graphs and other images are display samples (the data will not change). •The graphs simulate the production status of each location.
|
||||||
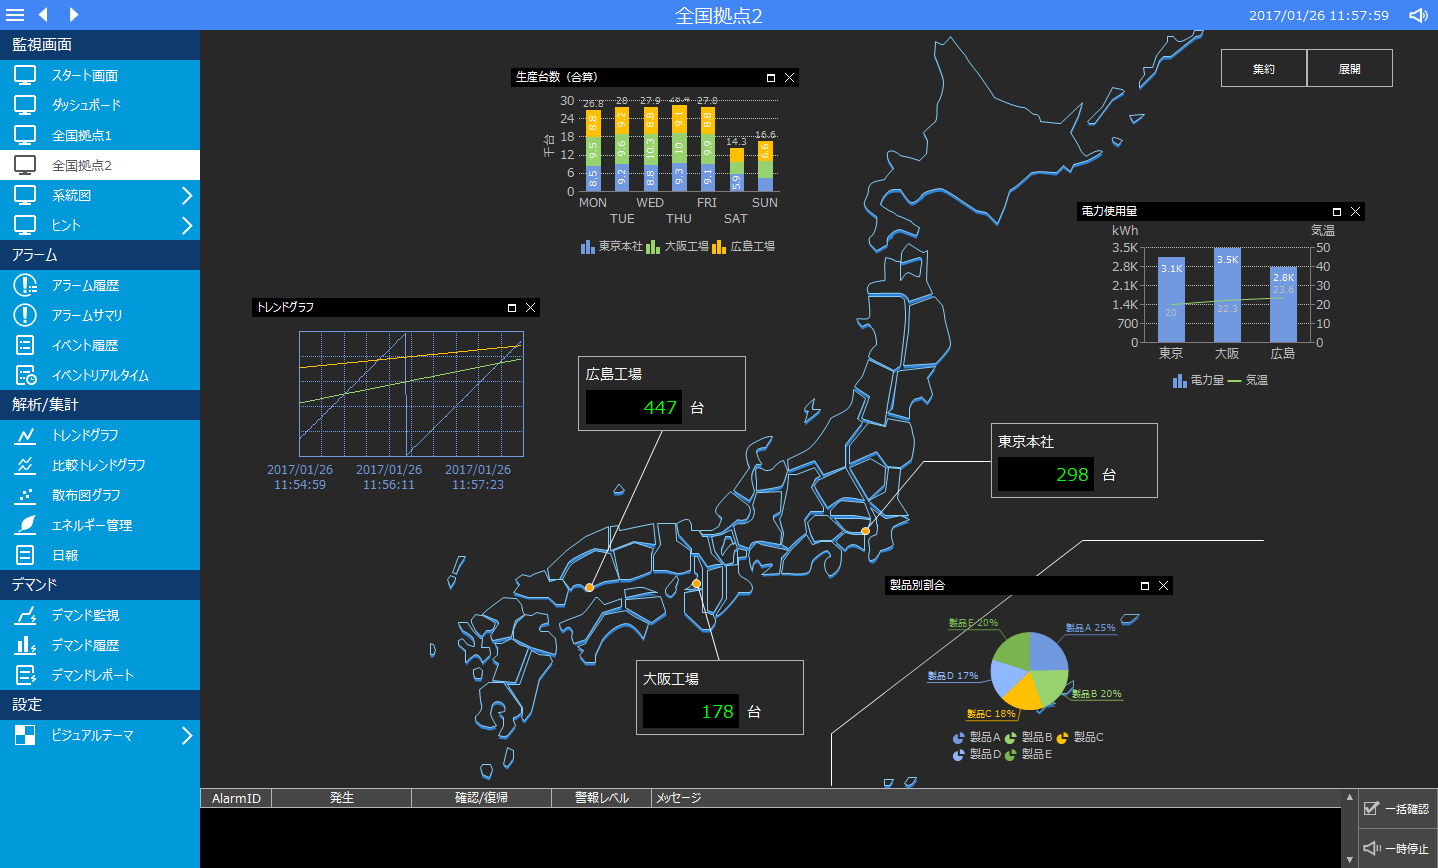
Nationwide base 2 (Screen creation example) |
|
•This is an example of a screen that simulates nationwide surveillance. •Graphs and other images are display samples (the data will not change). •The graphs simulate the production status of each location.
|
||||||
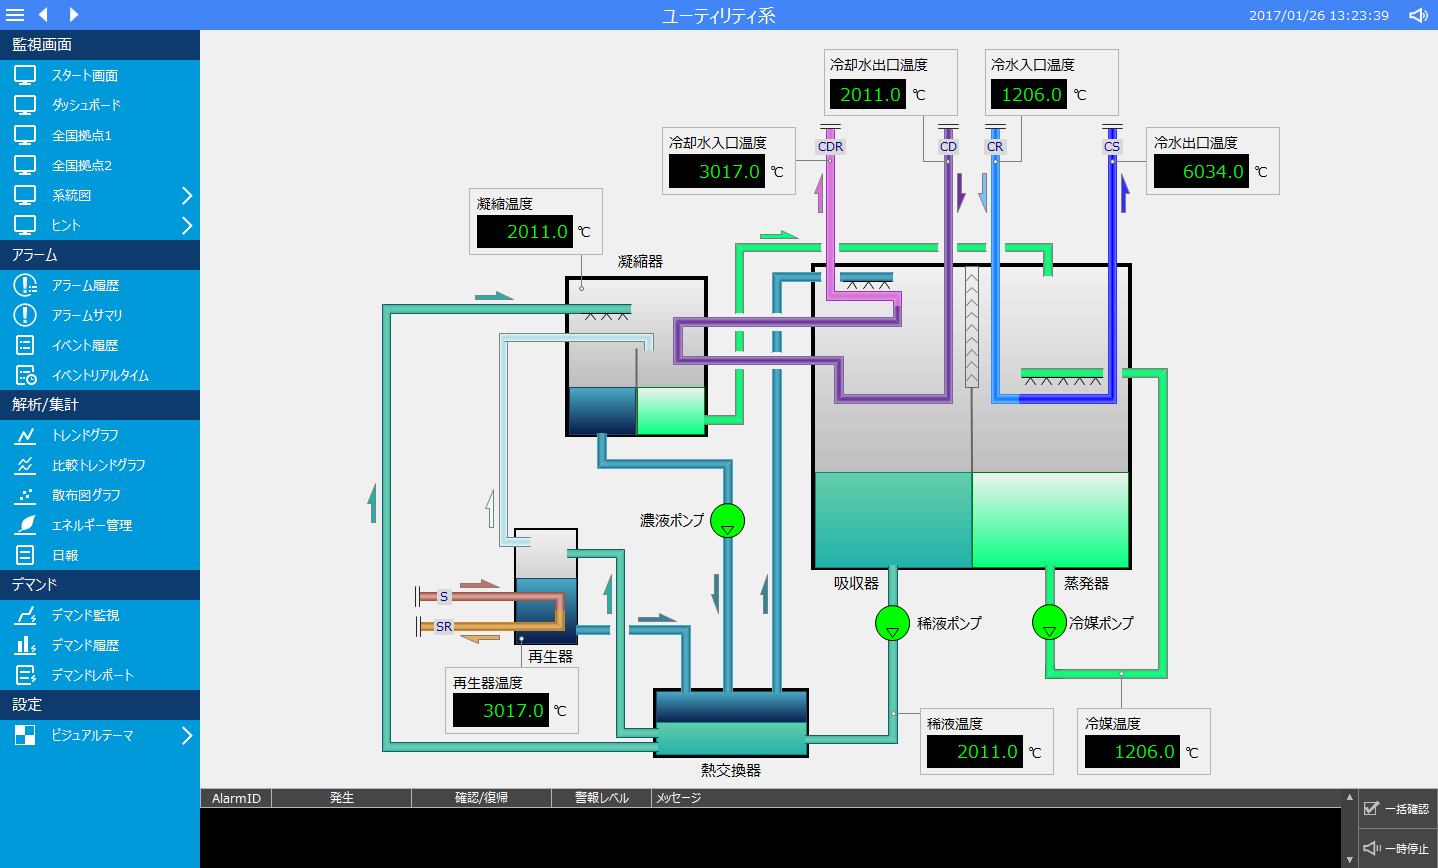
Utility (Screen creation example) |
|
•This is an example of a screen that simulates a utility piping system. •It simulates the ON/PLC signal, and the color of the symbol (component) changes. •It simulates the PLC signal values, and the values of the symbols (components) change. |
||||||
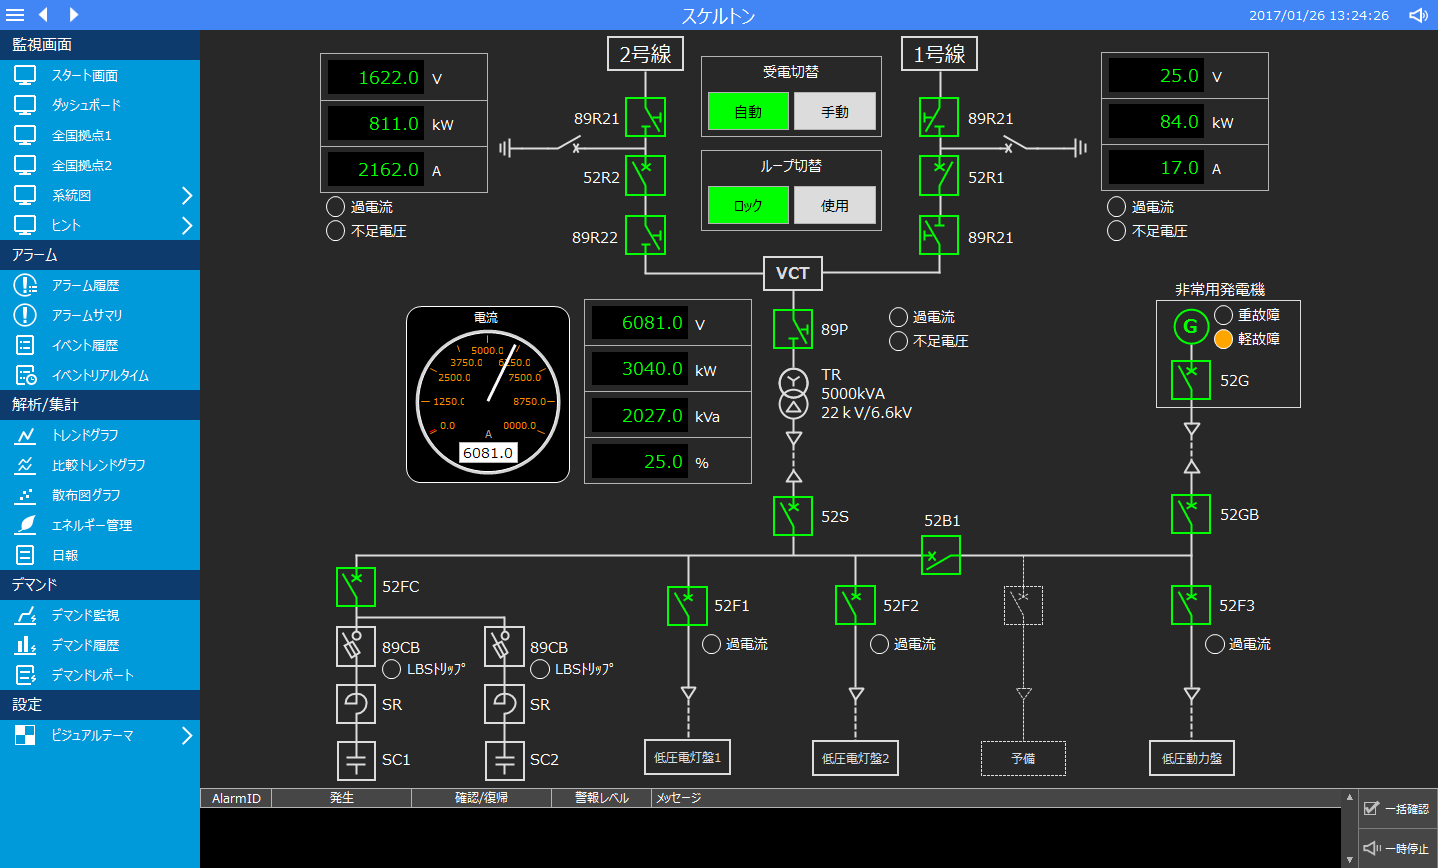
skeleton (Screen creation example) |
|
•This is an example of a screen that simulates a skeleton system of power equipment. •It simulates the ON/PLC signal, and the color of the symbol (component) changes. •It simulates the PLC signal values, and the values of the symbols (components) change. |
||||||
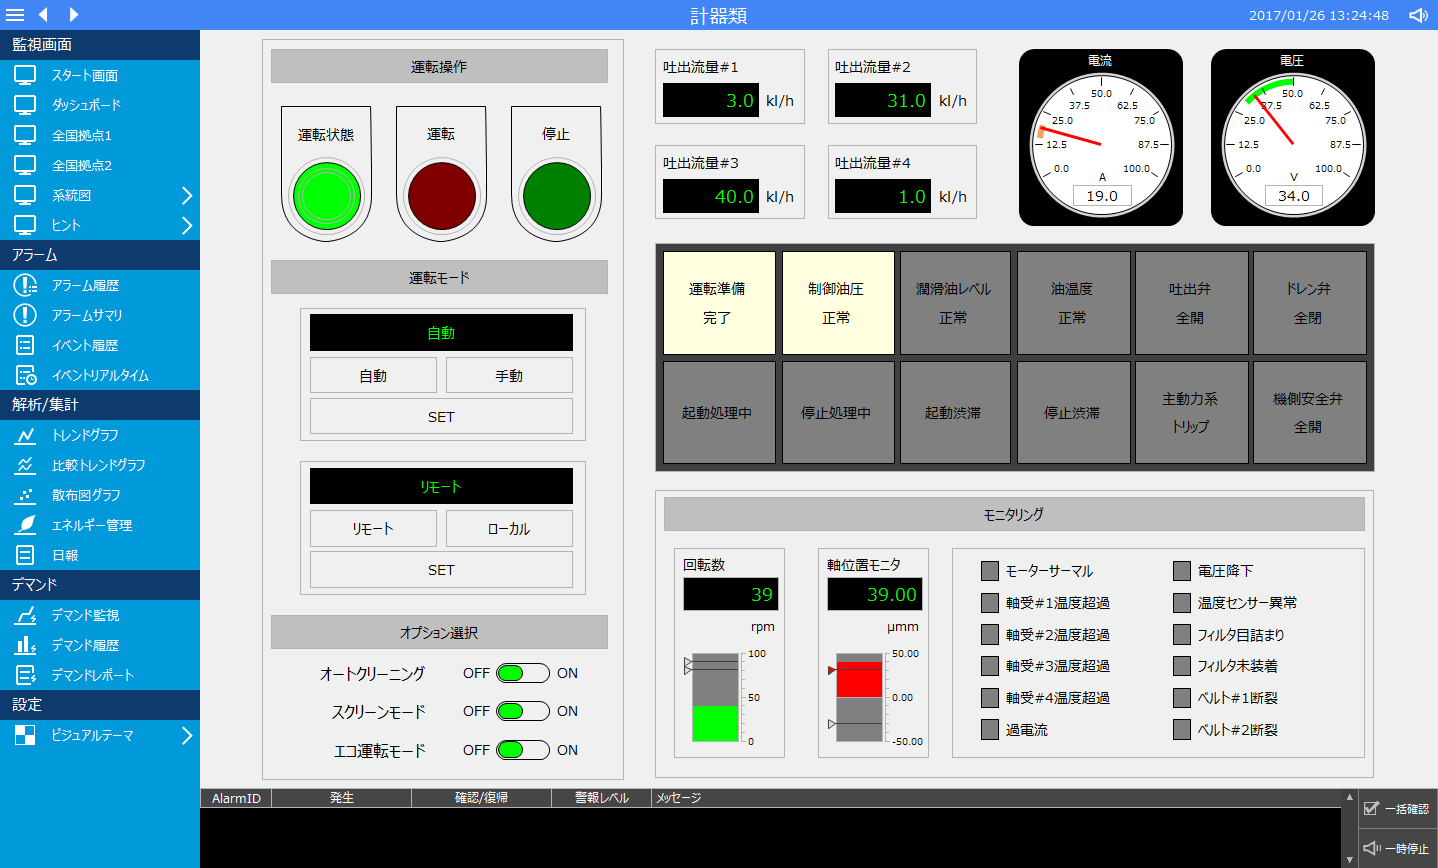
Instruments (Screen creation example) |
|
•This is an example of a screen that simulates the instrument display of equipment. •It simulates the ON/PLC signal, and the color of the symbol (component) changes. •It simulates the PLC signal values, and the values of the symbols (components) change. |
||||||
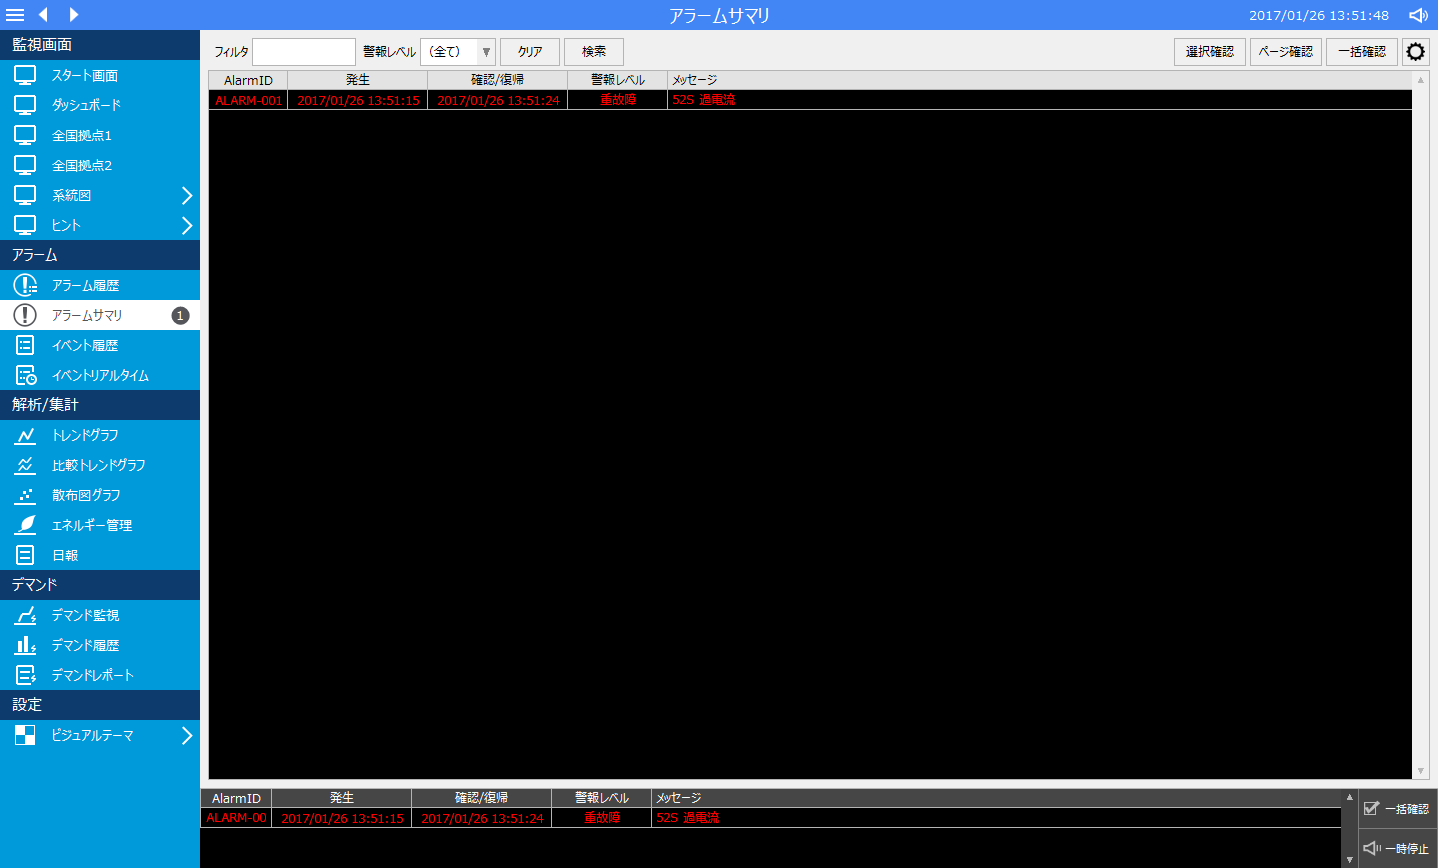
alarm •Alarm History •Alarm Summary
|
|
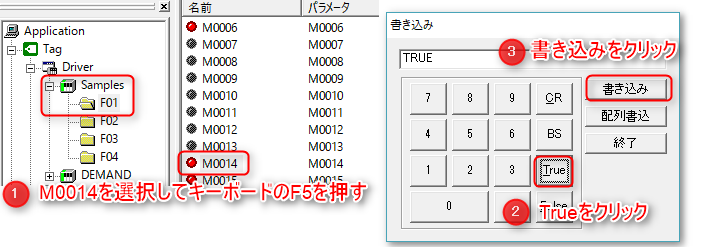
•Alarm monitoring function. •To simulate an alarm signal, follow the steps below. (When the alarm signal is turned ON, an alarm sound will sound.)
•The number of currently occurring alarms is displayed next to "Alarm Summary" in the menu. •Currently active alarms are always displayed at the bottom of the screen.
To stop the alarm, click "Pause" at the bottom right of the screen.
|
||||||
trend •Trend Graph •Comparative Trend Graph |
|
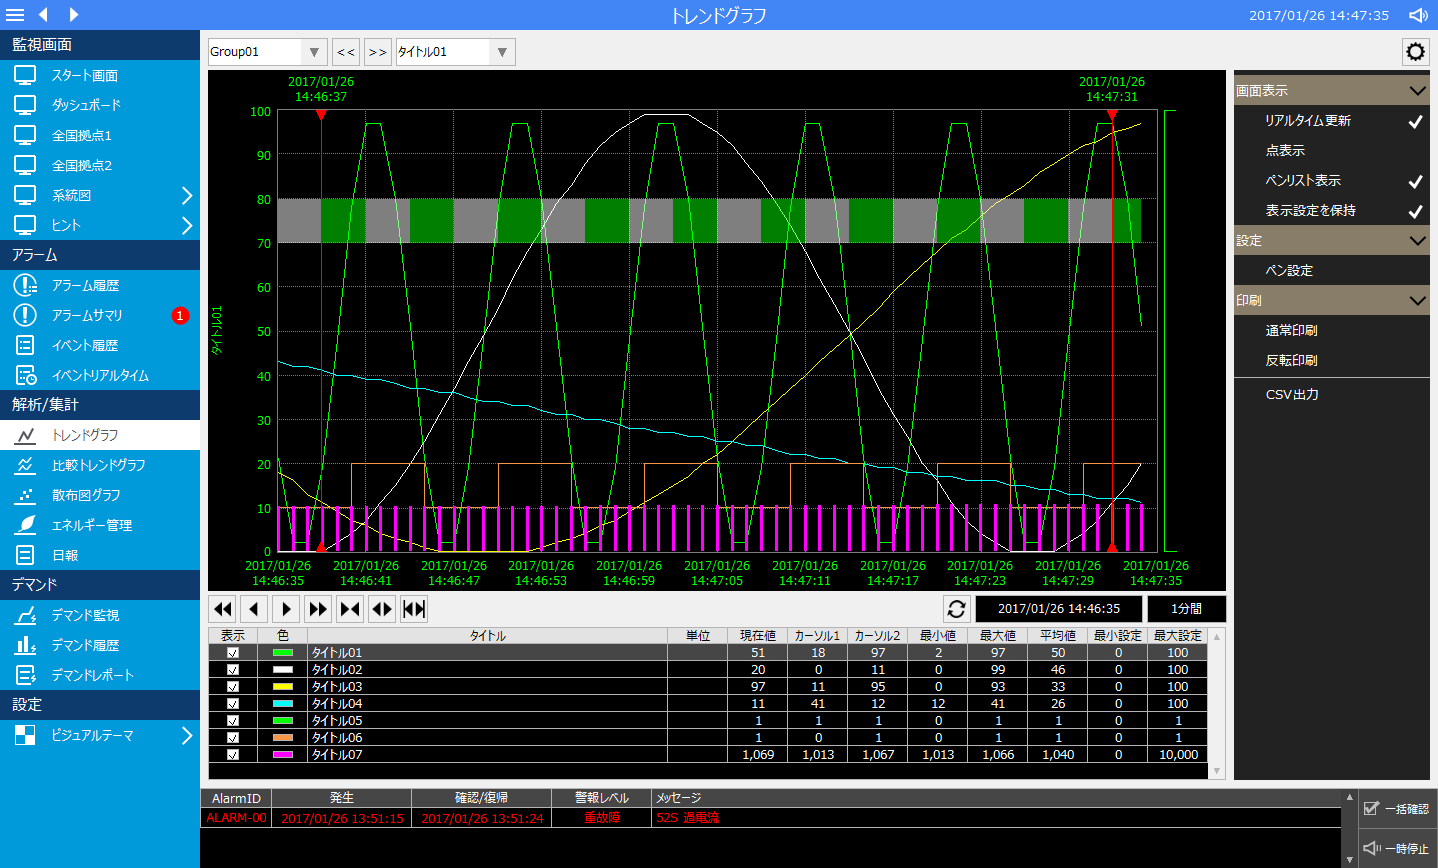
•Trend graph function. •Pen information is registered as a sample. •Comparative trend graphs allow you to display trends over different time periods side by side.
|
||||||
Signal List |
|
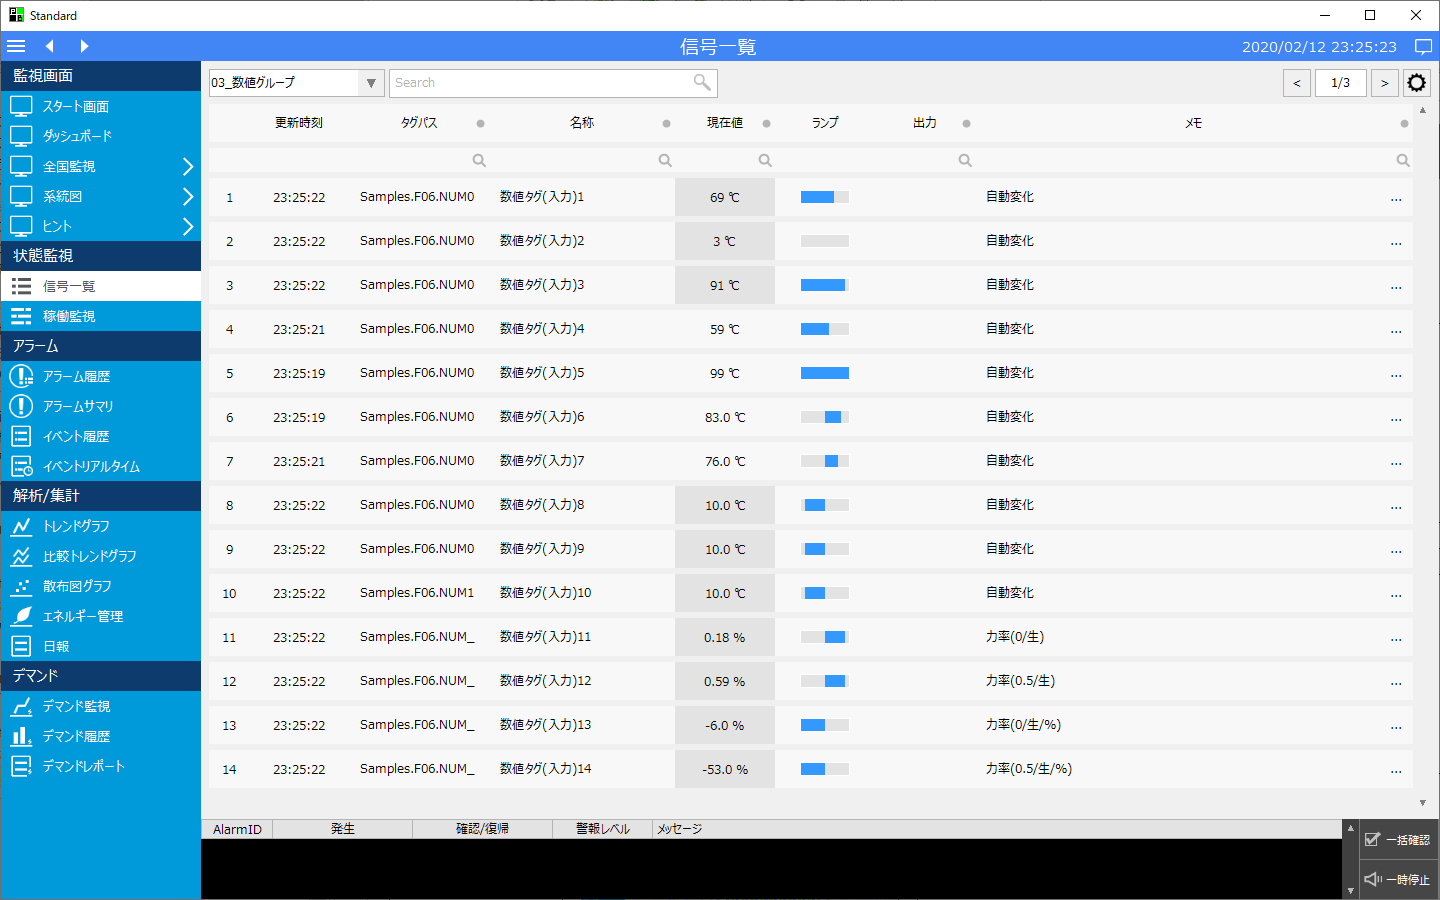
•Signal list function. •Tag settings are registered as samples. •You can freely set the display information for groups and tags from the settings screen. |
||||||
Operation monitoring |
|
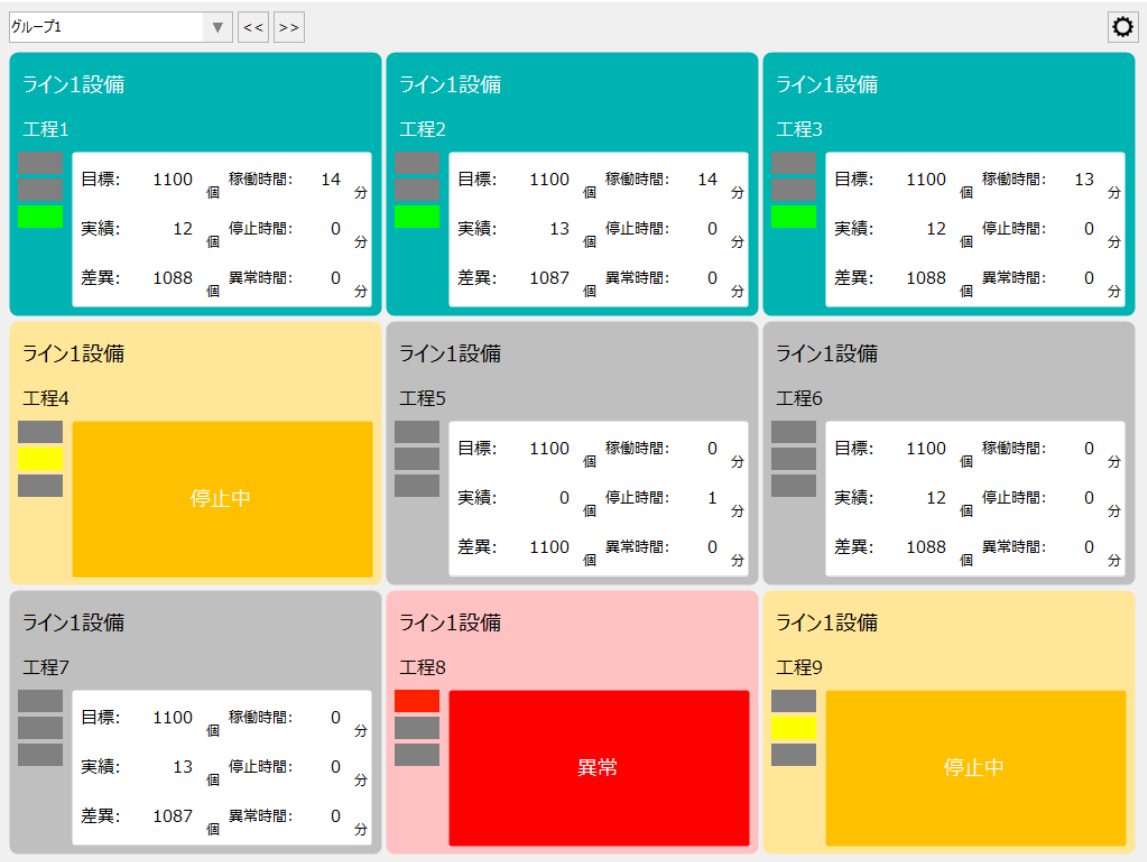
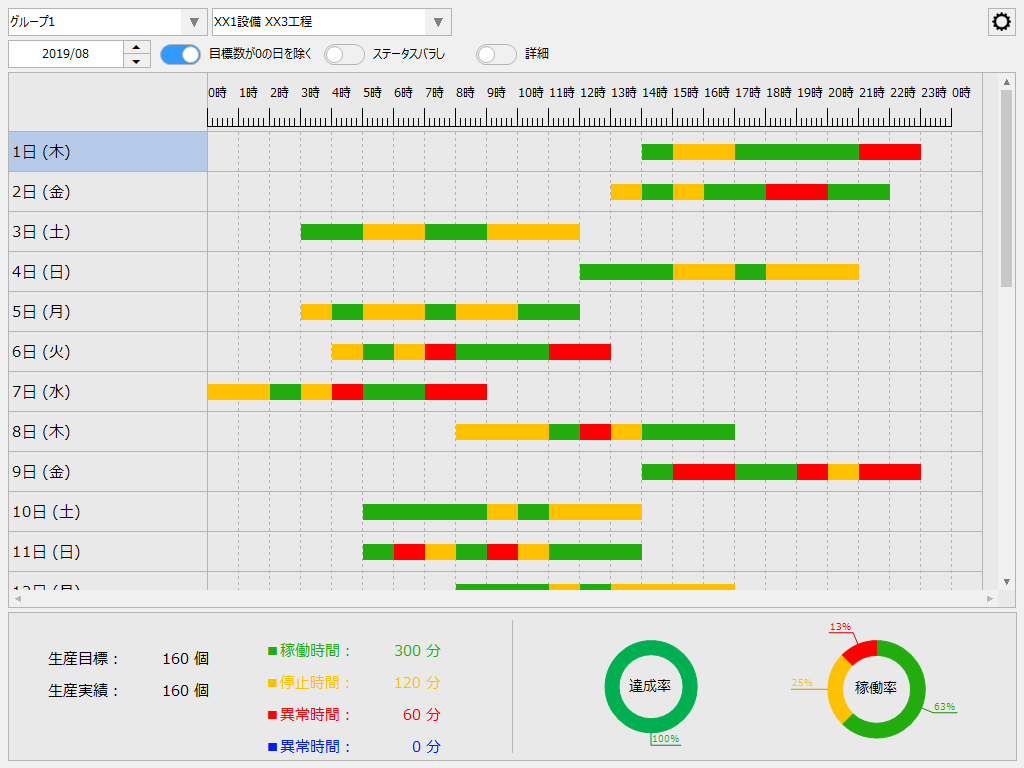
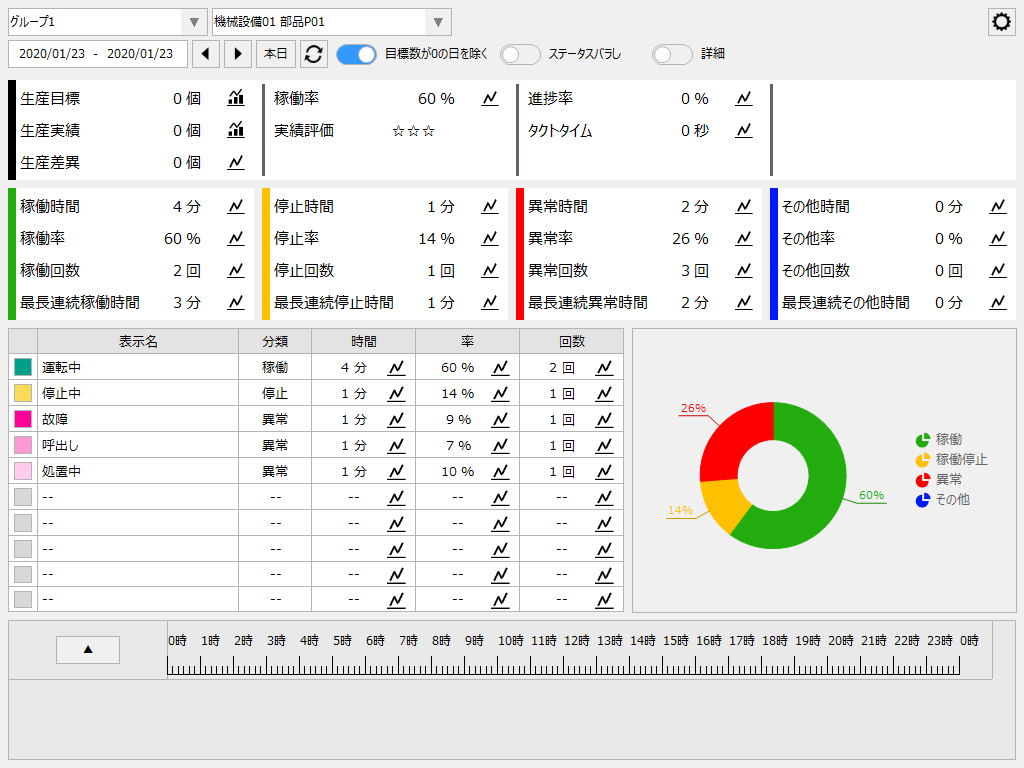
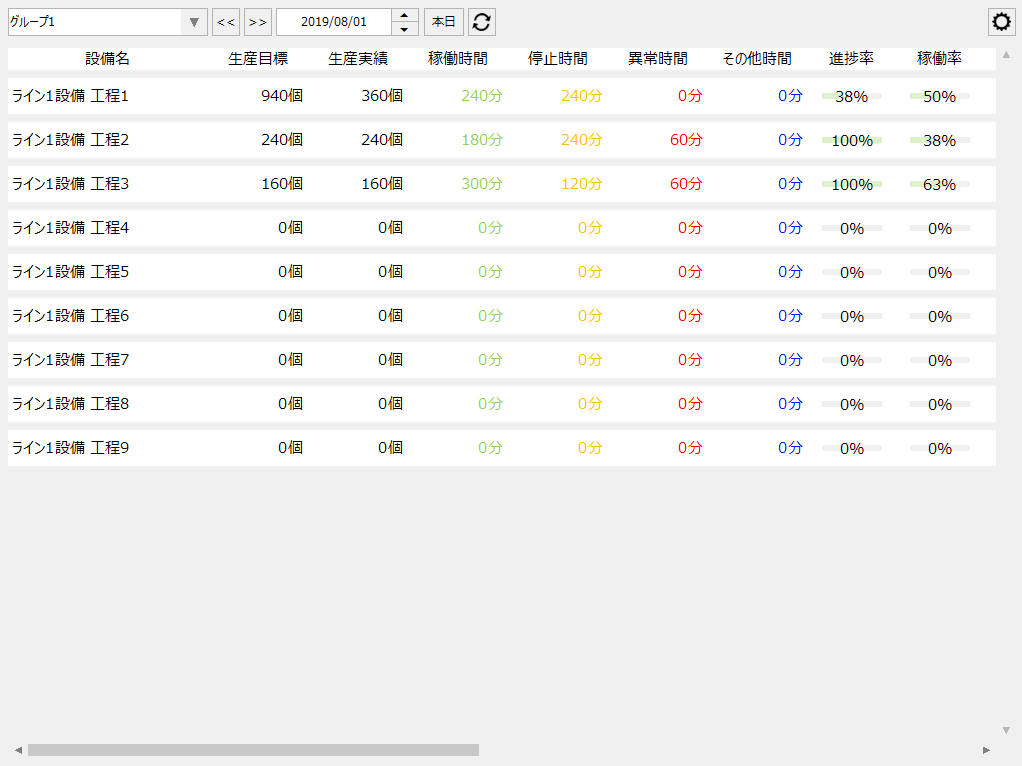
•Operation monitoring function. You can monitor the operation status of equipment. •In addition to the Andon display, you can display the operation status in a Gantt chart and analyze the details of the operation status. •The following date data is provided as sample data:
Main screen:
|
||||||
Scatter Plot Graph
|
|
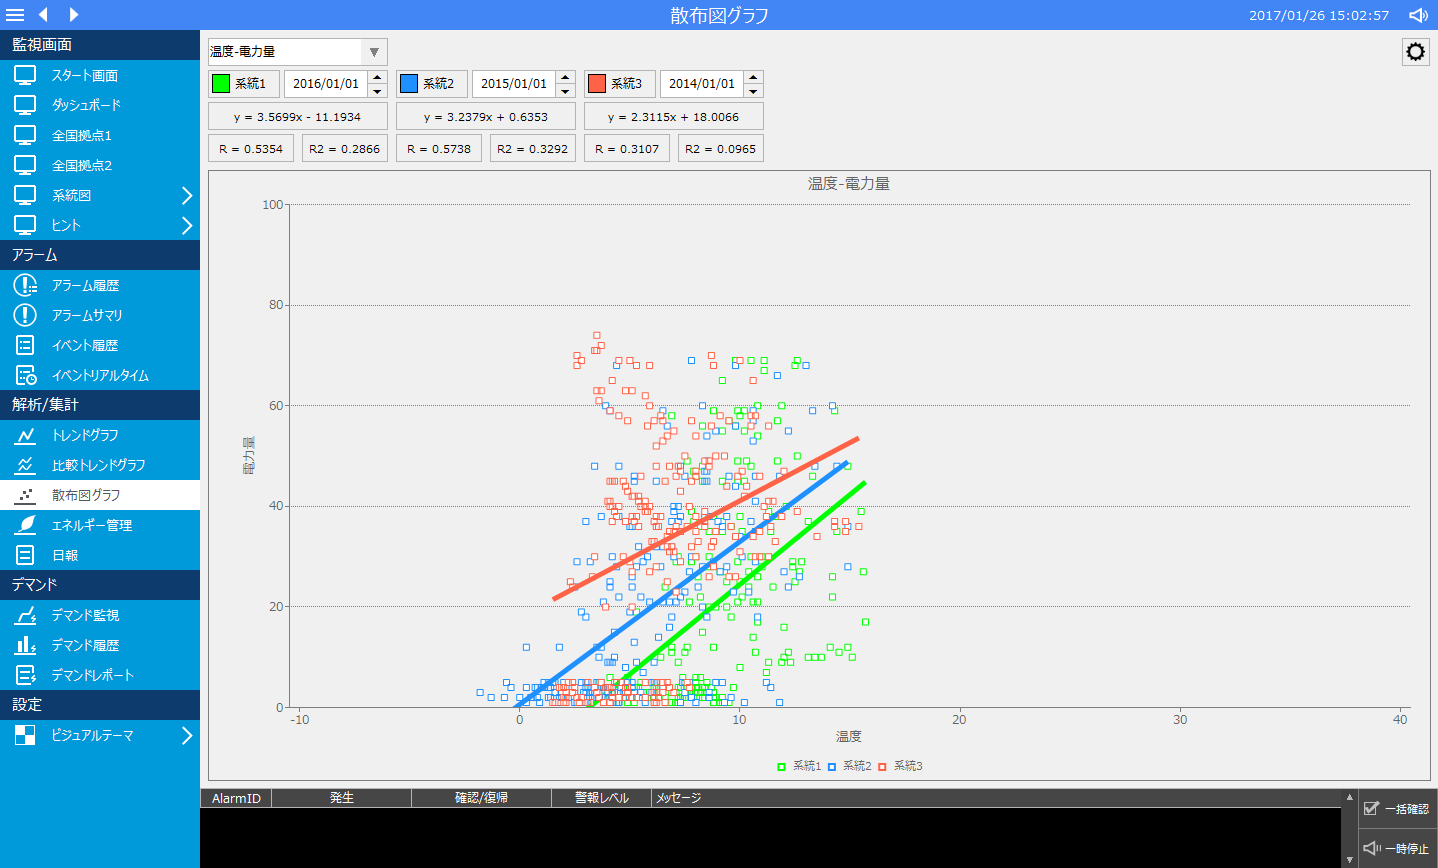
•Scatter plot graph function. •Point data is registered as a sample. •The following date data is provided as sample data: |
||||||
Energy Management |
|
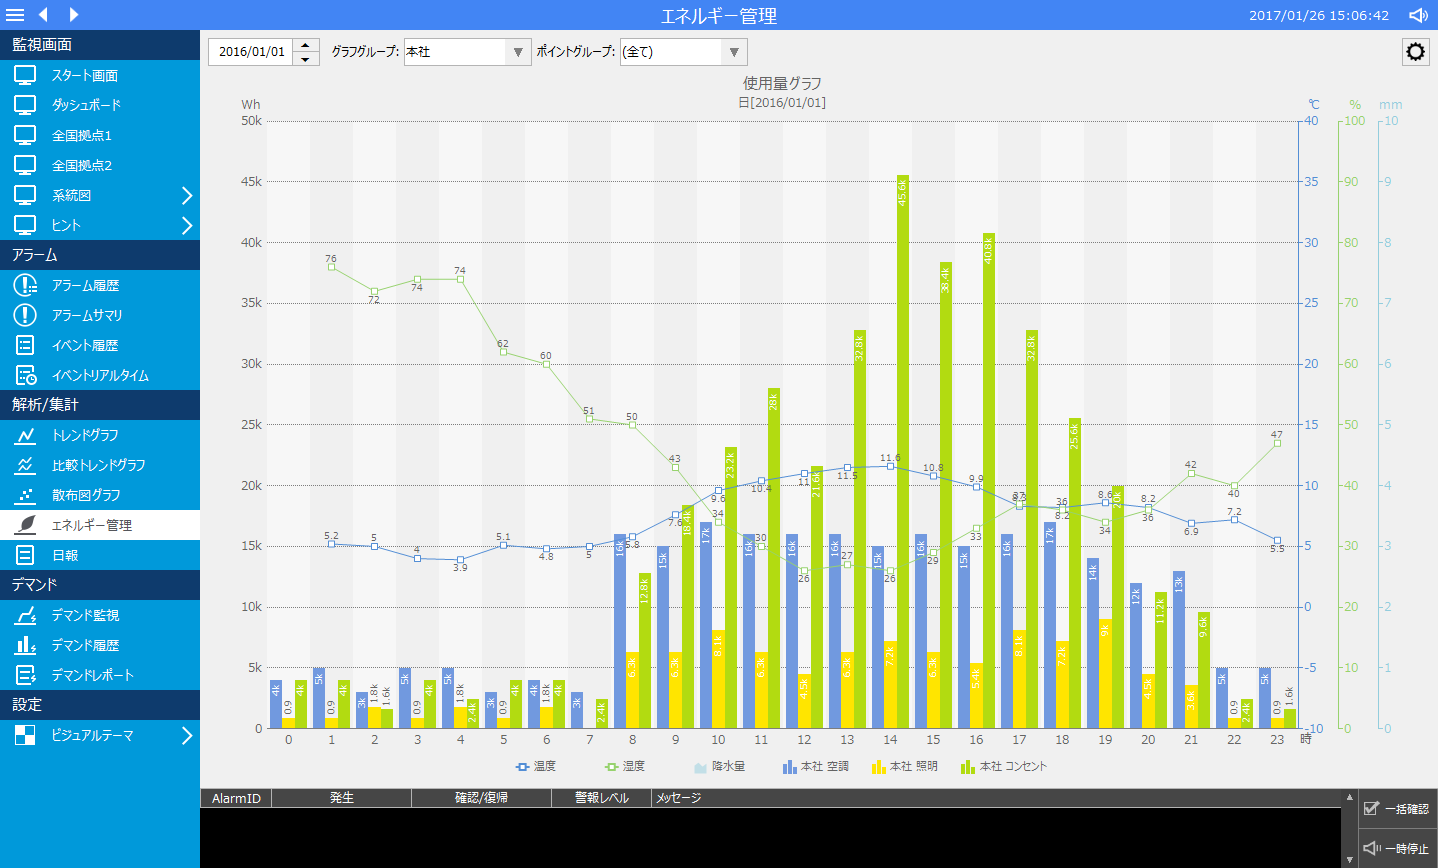
•Energy management function. •Point data is registered as a sample. •The following date data is provided as sample data: |
||||||
Daily Report |
|
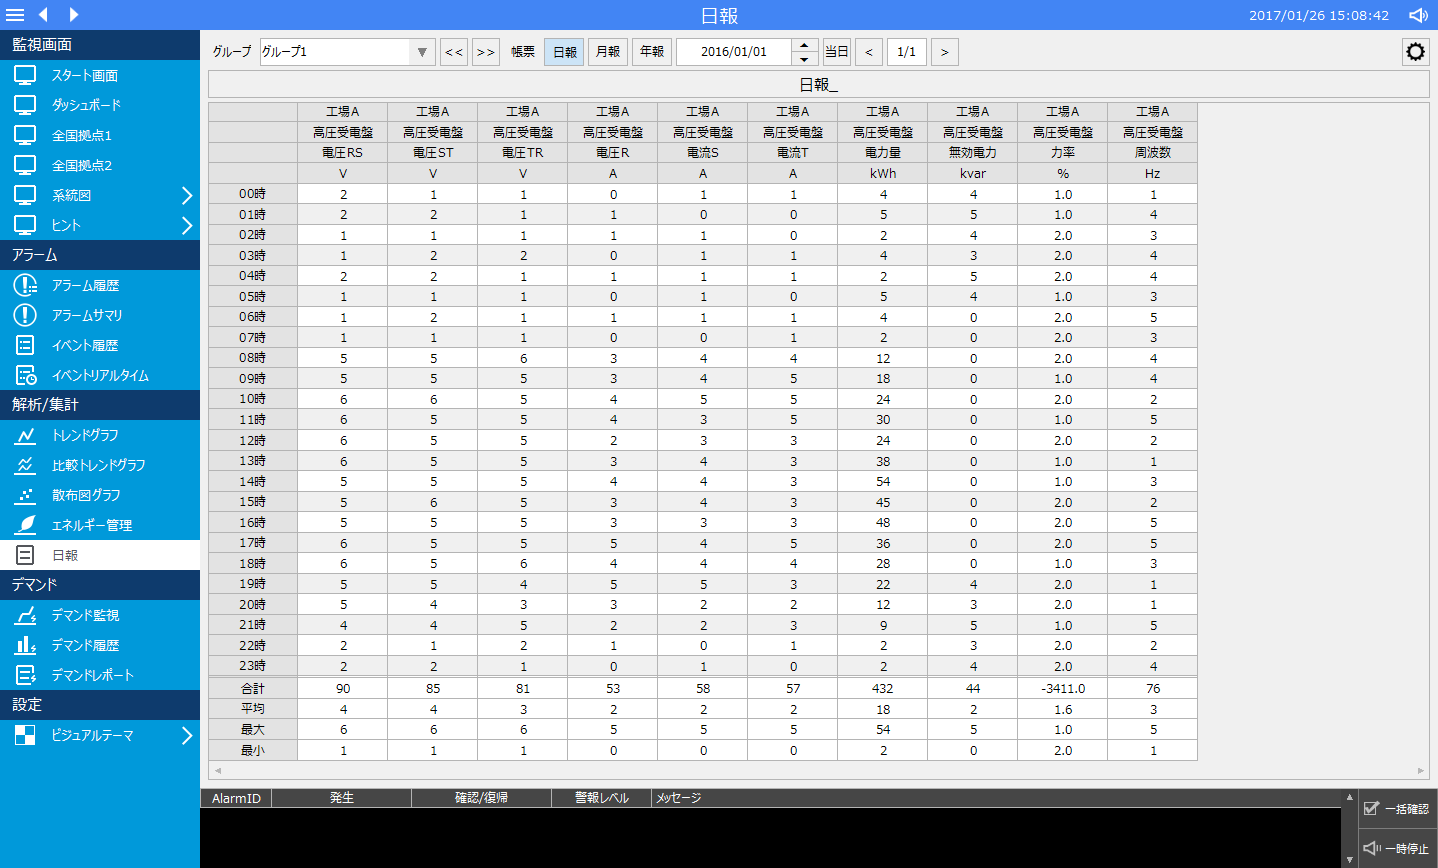
•Daily report (monthly report/yearly report) function. •The following date data is provided as sample data: |
||||||
Demand Monitoring |
|
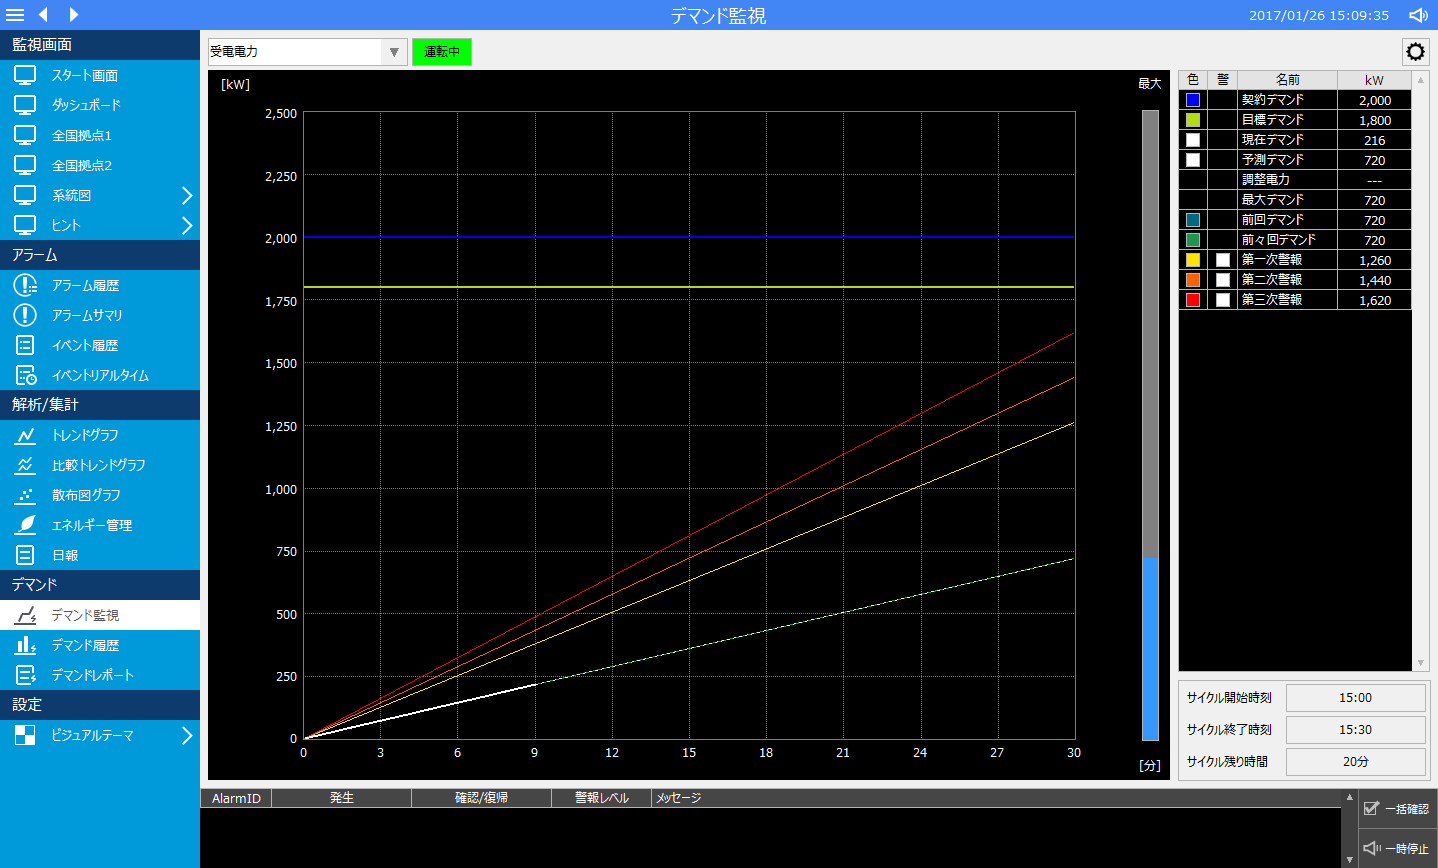
•Demand monitoring function. •We have entered some sample data and plotted the demand forecast over time. |
||||||
Demand History |
|
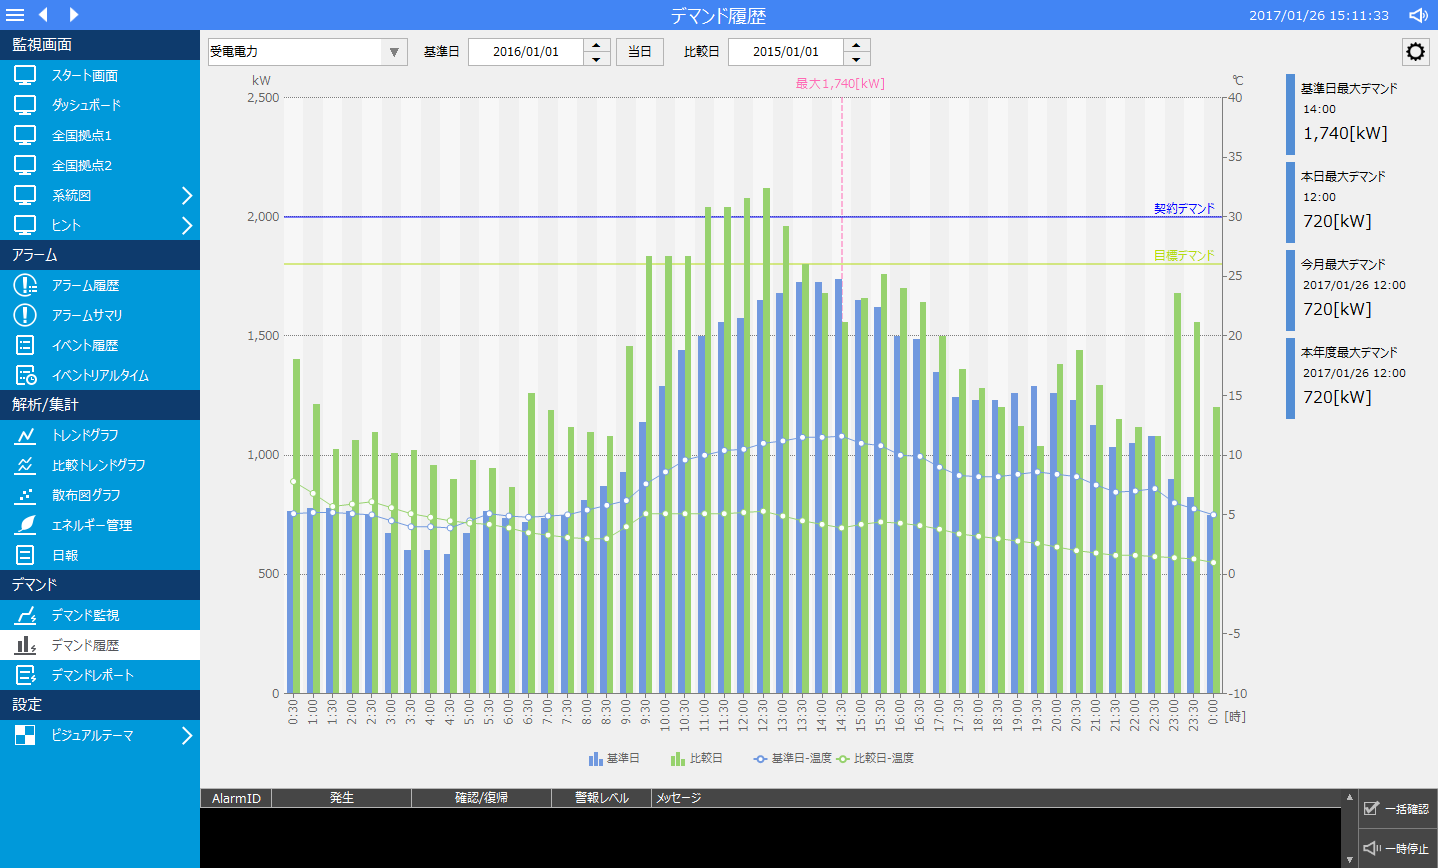
•Demand history function. •The following date data is provided as sample data: |
||||||
Demand Report |
|
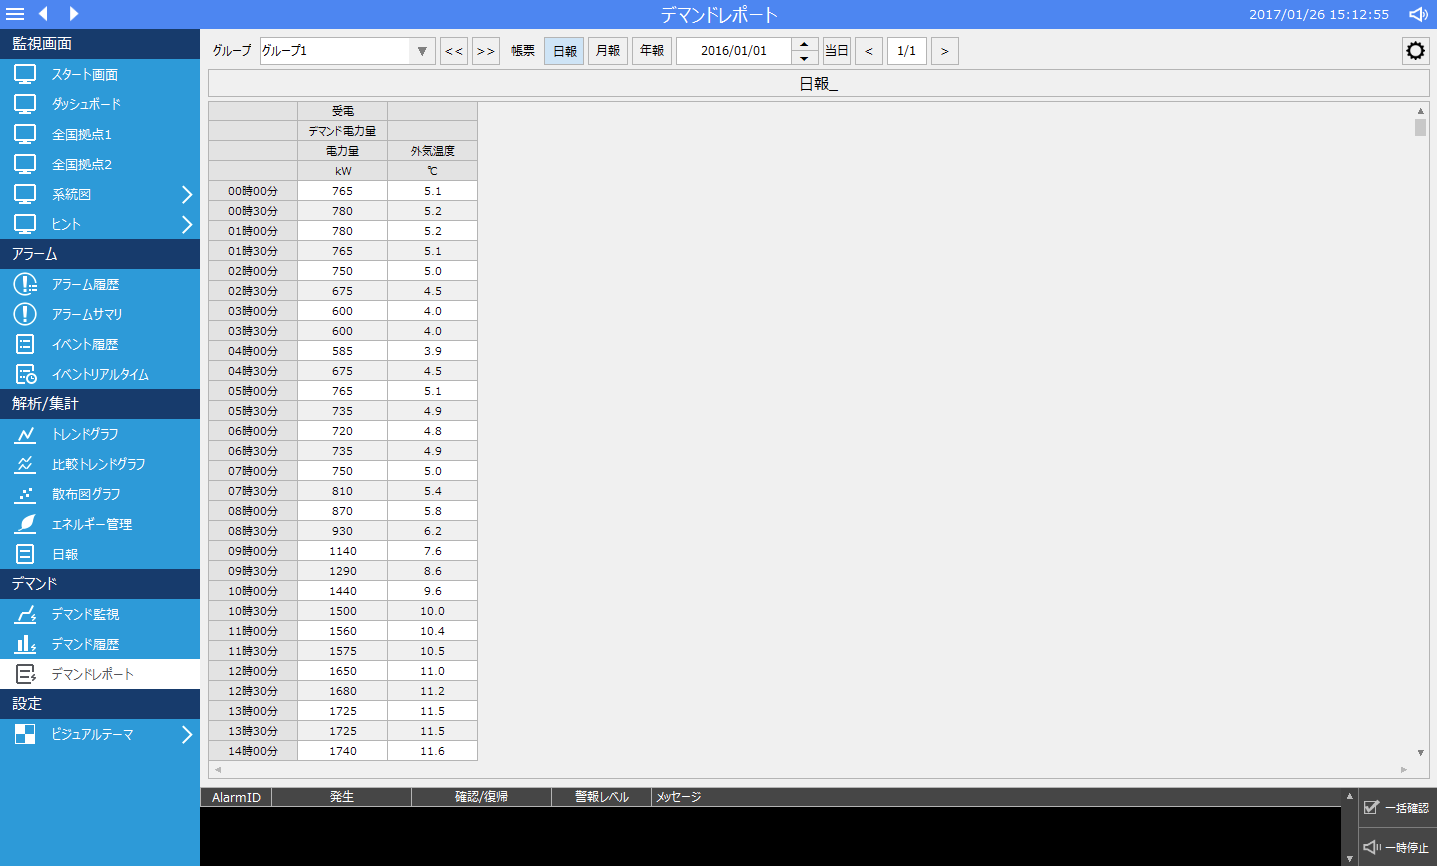
•Demand report function. •The following date data is provided as sample data: |
||||||
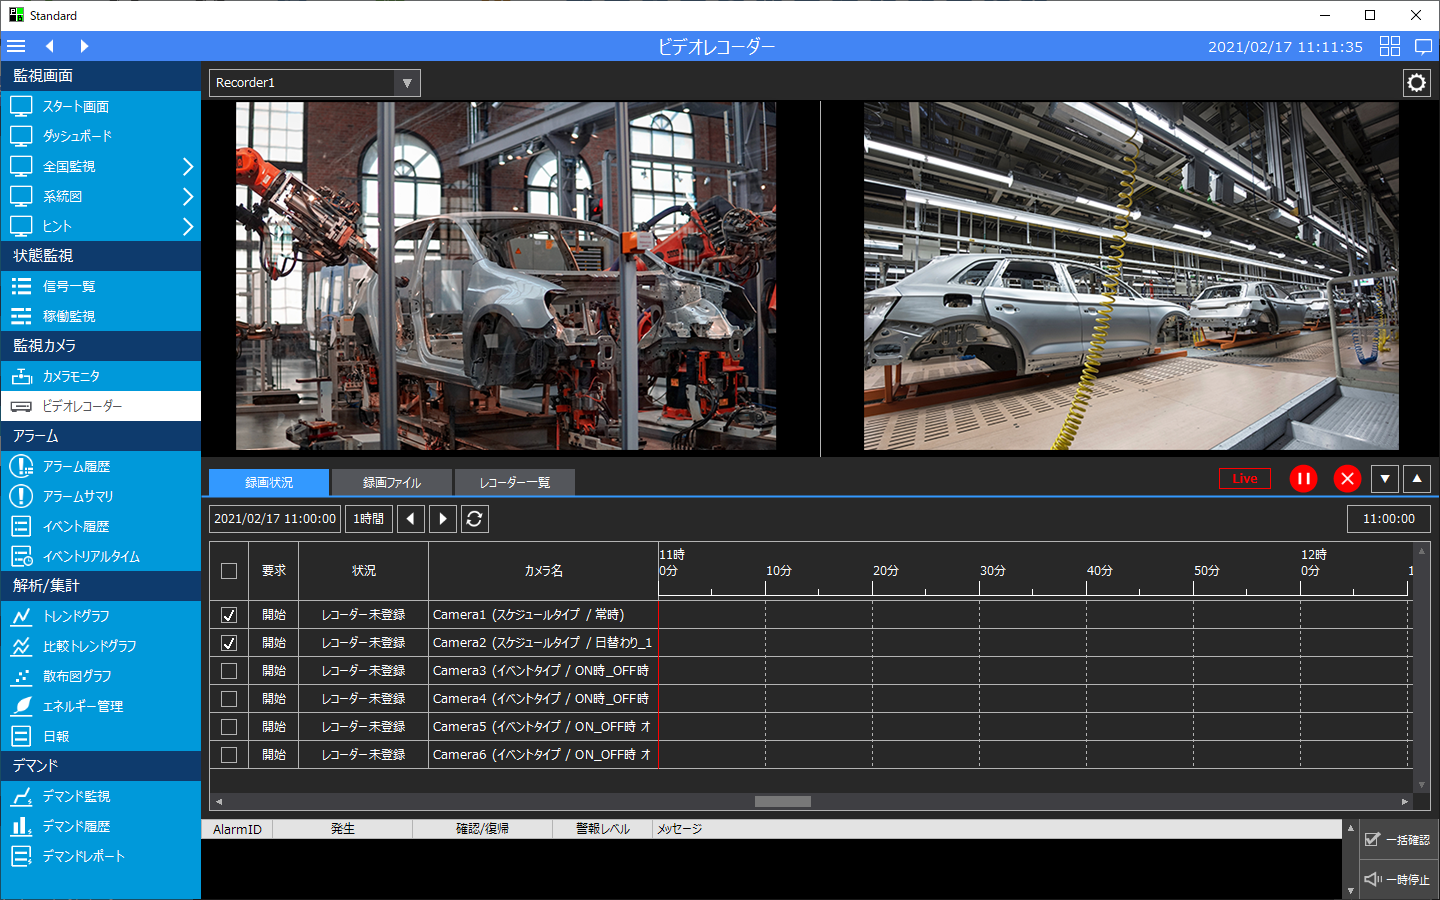
Video Recorder |
|
•This is a function for recording/playing back video from general-purpose network cameras. In addition to recording by schedule setting, you can also record by event conditions by referencing tag values, and embed (overlay) tag values into the recorded video. You can also include a specified number of seconds of video before and after an event occurs in the recording. •Instructions on how to use the video recorder are provided in "Video Recorder" of the Surveillance System Construction Guide. •The following dated data is provided as sample recording data.
|
||||||
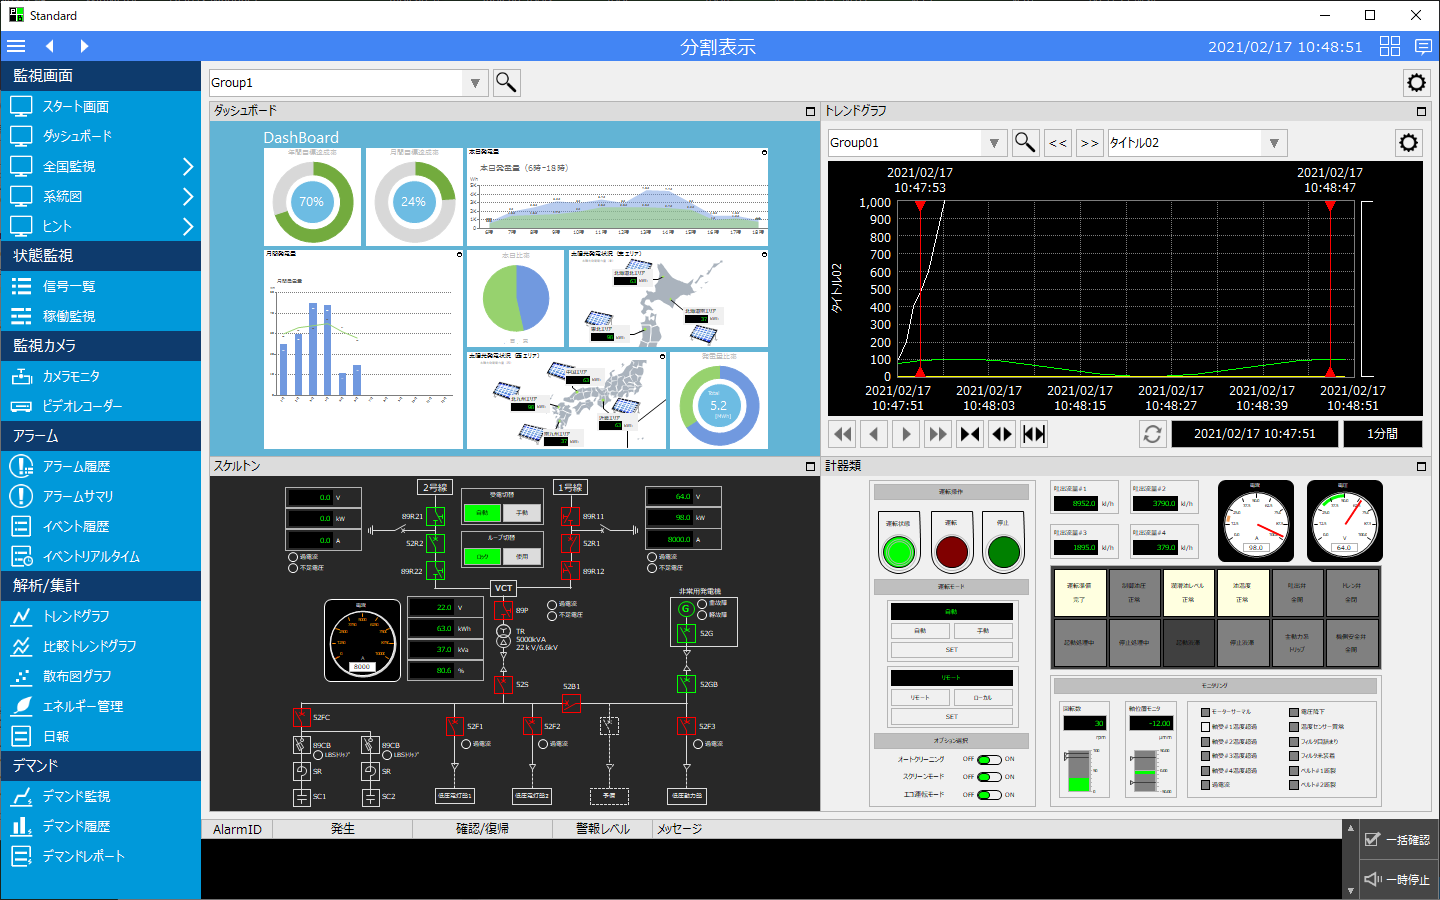
Split View (Camera monitor) |
|
•Click the following icon in the upper right corner of the screen to open the split display screen. You can freely add groups and register the combination of split displays. The number of rows and columns can be freely set, and flexible layouts can be defined by merging display frames.
•In addition to the graphic screen, the split display can also display images from network cameras. In addition to displaying live images, you can also play back images recorded with the video recorder function in the split display frame. •How to use the split display is described in "Split Display (Camera Monitor)" of the Surveillance System Construction Guide. |
||||||
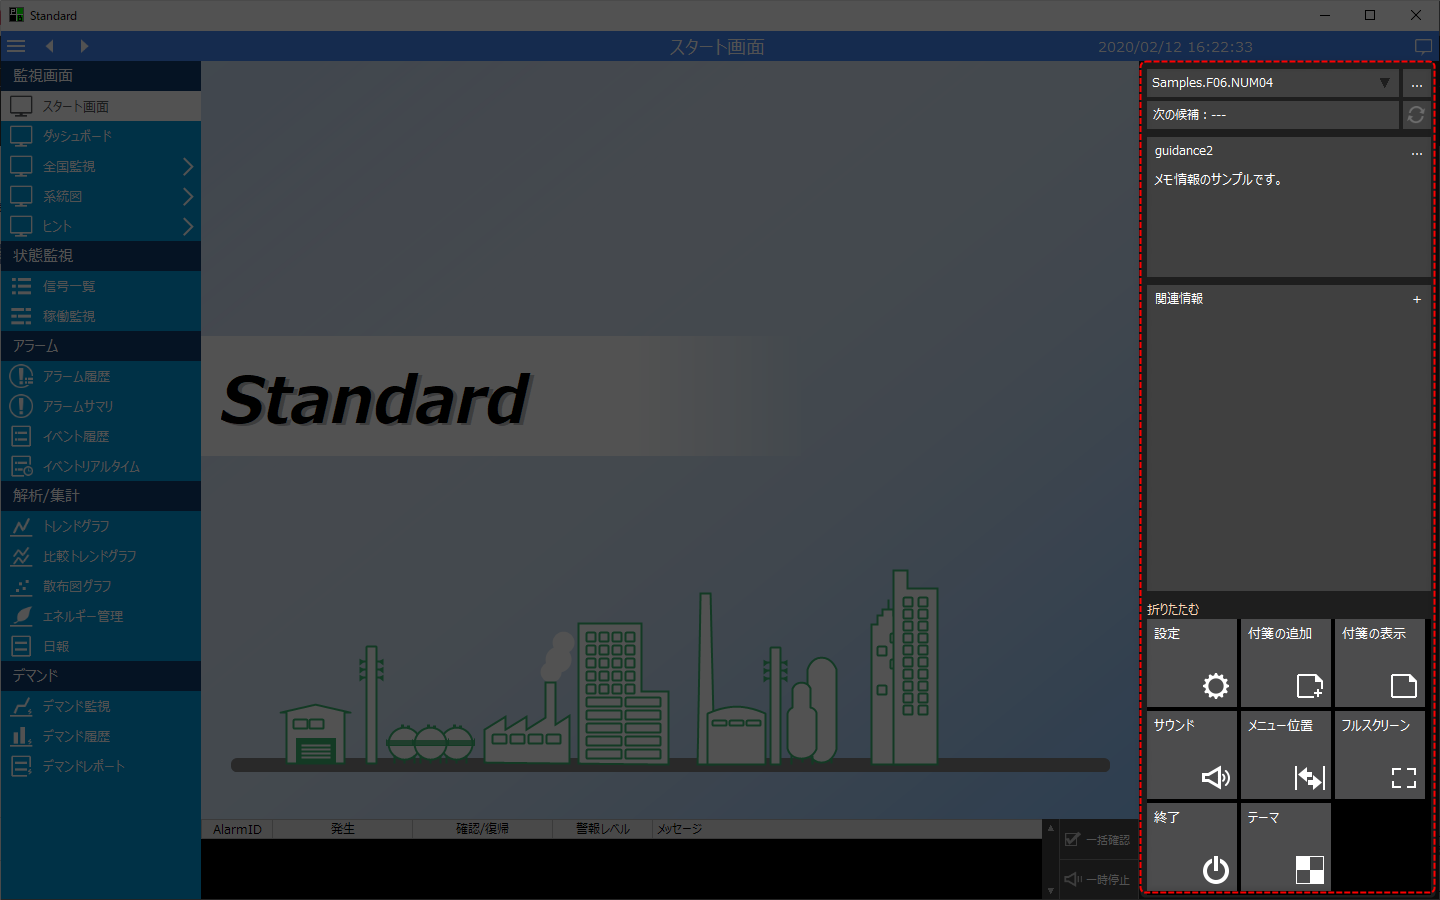
Information Bar |
|
•You can display the "Information Bar" by clicking the following icon in the upper right corner of the screen. The Information Bar will be displayed on the right side of the screen.
•The information bar displays a variety of functions in a complex manner, including a memo function (guidance function), related information function, and login function. How to use the information bar is described in "Information Bar" of the Surveillance System Construction Guide. |
||||||
guidance |
|
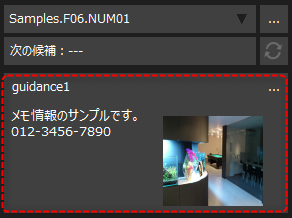
•Guidance information can be registered to tag information, etc. The guidance information will be displayed in the information bar. •Instructions on how to use the guidance function are described in "Guidance" of the Surveillance System Construction Guide. |
||||||
Related information |
|
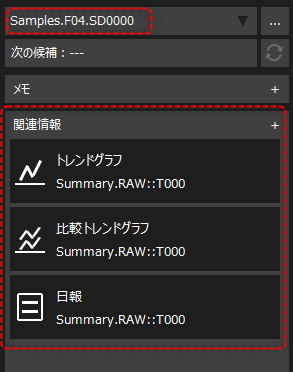
•The information bar can display information related to the currently selected information as "related information." Clicking related information will open the screen for the related target based on the currently selected information (tag, alarm, data source, start/end date and time, etc.). •Instructions on how to use the related information function are provided in the Surveillance System Construction Guide, under "Cooperation between Functions (Use of Related Information)". |
||||||
Sticky note function |
|
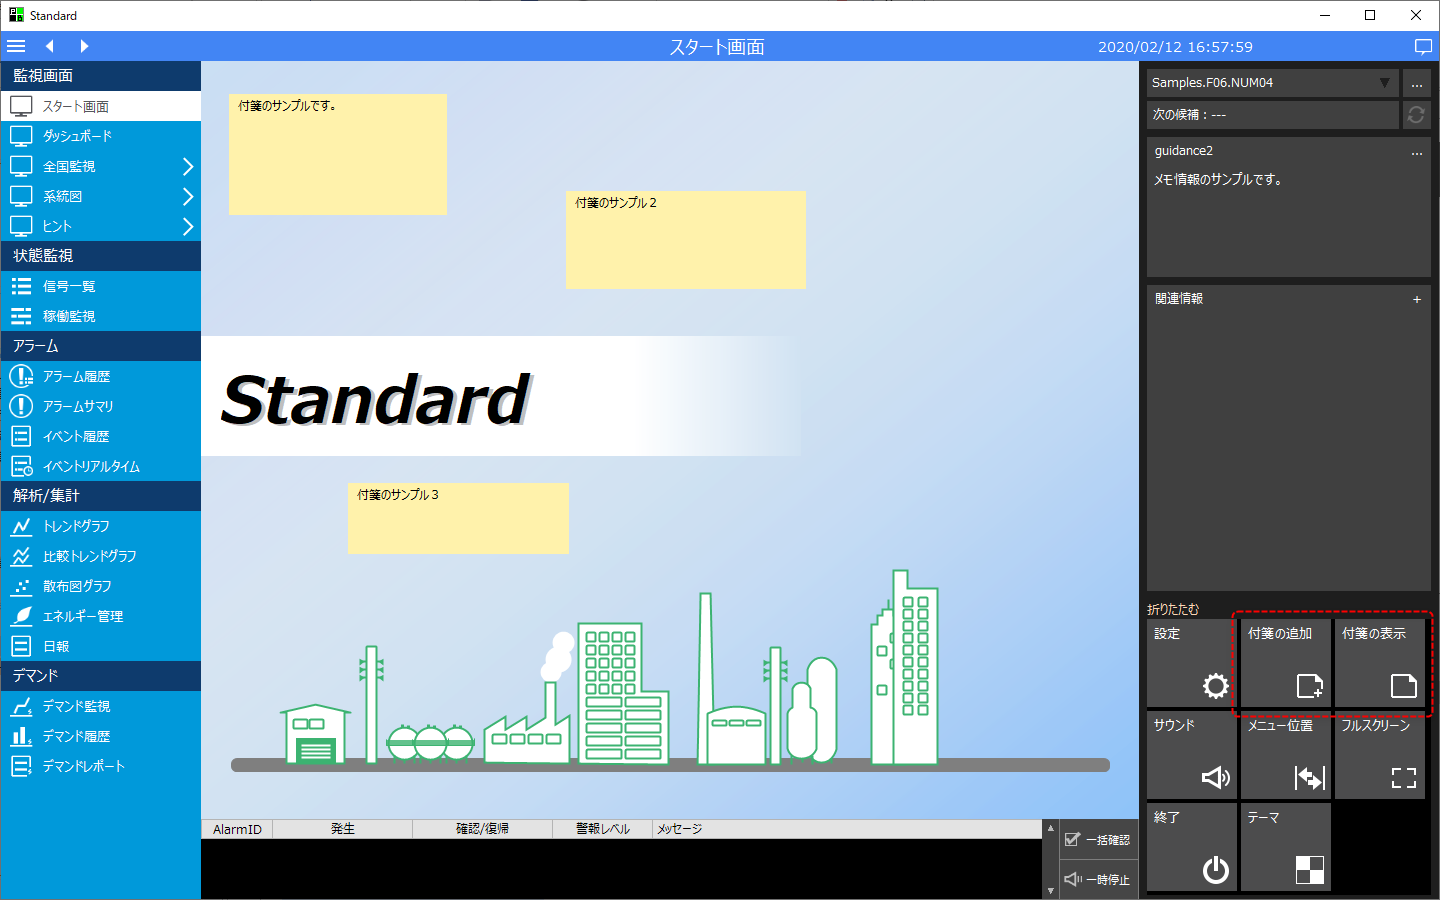
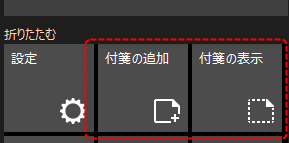
•The sticky note function allows you to paste sticky notes on the screen. Sticky notes can be pasted freely on any screen. •You can attach sticky notes, show/hide items, and more using the icons on the information bar.
•Instructions on how to use the sticky note function are provided in "Sticky Note Function" of the Surveillance System Construction Guide. |
||||||
User Management (Login)/System Settings |
|
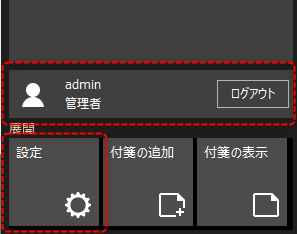
•A user management function (login function) is provided. The currently logged-in user is displayed in the information bar, and you can log in and out from here. •The login operation mode, the operation authority given to the group to which the user belongs, etc. can be configured from the system setting screen while the system is in operation. To display the settings, click the "Settings" icon on the information bar. •Instructions on how to use the user management function are provided in "Introduction to user management functions" in the Surveillance System Construction Guide. |
||||||
Visual Theme |
|
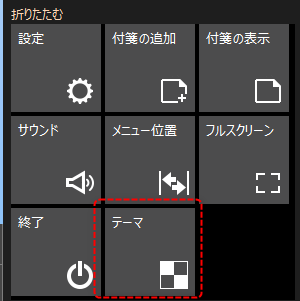
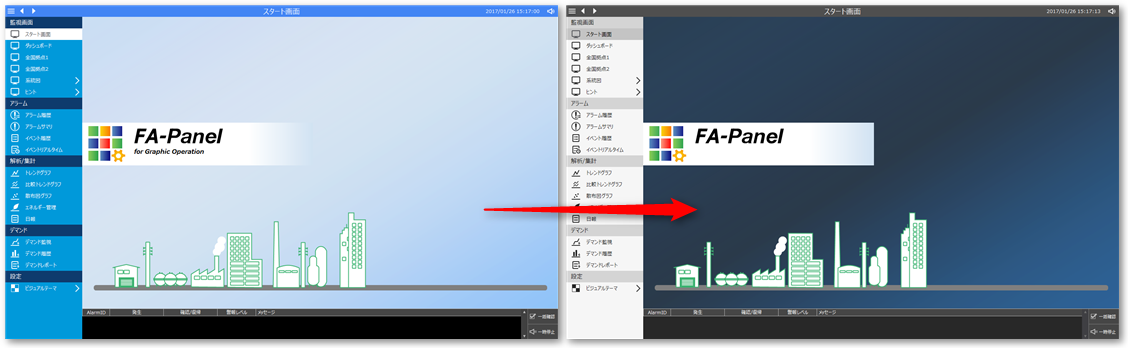
•You can change the visual theme by clicking the icon at the bottom of the information bar. •By changing the visual theme, you can change the color scheme of the screen during operation.
|