Energy management screen operation
This section describes the basic operations on the energy management screen.
■Select the display period
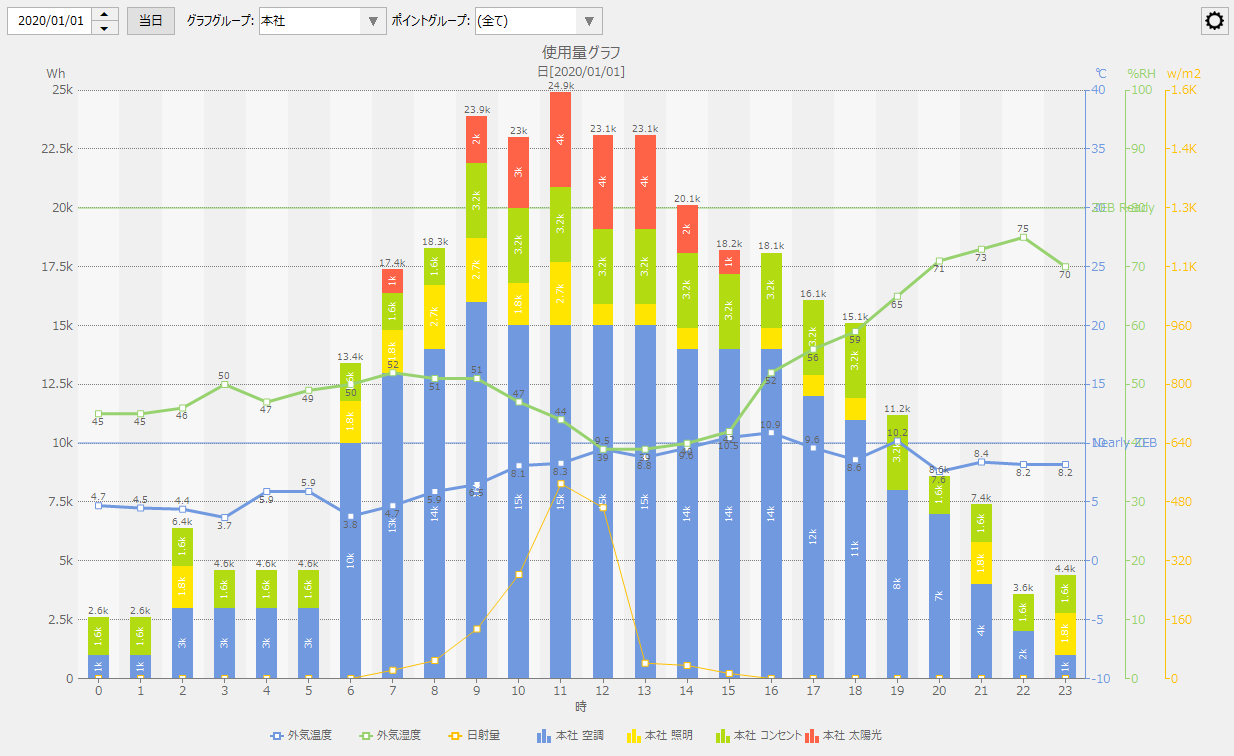
The period of data to be displayed on the graph is selected by selecting the date at the top of the graph screen.
(Example of usage graph)

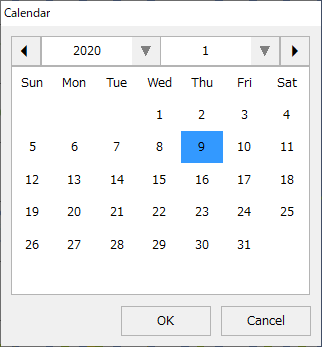
When you click on a date, the following selection dialog will be displayed. You can also use the spin buttons (up and down buttons) to select a date.
(Date selection dialog)
Clicking the "Today" button will change the date to the current day.

■ Switching the display group
You can switch the group displayed on the graph by selecting the group at the top of the graph.
(Example of usage graph)

Note that the group selection operation differs depending on the type of graph. For details on group operations and graph display, please refer to "Relationship between groups and graph display".
■ Show/hide graph
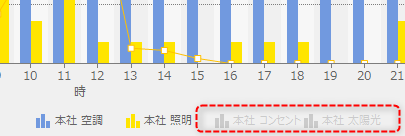
Clicking on the legend at the bottom of the graph will toggle between showing/hiding the graph for that series.
■ Show/hide the settings menu
Basic operations on the energy management screen are performed from the settings menu.
To display the menu, click the settings icon (gear icon) in the top right corner of the screen.
■ Changing the graph period
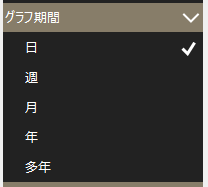
In the "Graph Period" setting menu, you can select the graph display period.
■ Changing the graph type
To change the graph type, open "Graph Type" from the settings menu and select the desired graph.
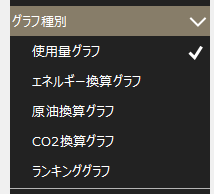
For details about graph types, please refer to "Energy management graph types and display methods".
■ Changing the graph display method
In the "Display Method" setting menu, you can select how the graph is displayed.
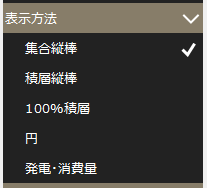
For details on how to display the graph, please refer to "Energy management graph types and display methods".
■ Selecting the graph display mode
You can select the graph display mode from the following part of the settings menu.
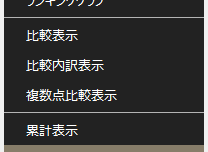
For details about the graph display mode, please refer to "Energy management graph types and display methods".
■ Printing
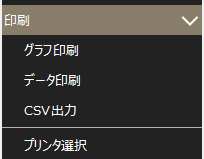
In the "Print" setting menu, you can perform the following operations.
|
Selecting "Print Graph" will print a hard copy of the currently displayed graph screen image. Selecting "Print Data" will print the data of the currently displayed graph in list format. By selecting "CSV Output", you can save the data of the currently displayed graph to a CSV file. By selecting "Select Printer", you can select the printer to print on. |
■ Display settings
In the "Display Settings" menu, you can configure various settings for graph display.
|
|