Once you have registered the tag, you can configure the various settings from the operation monitoring settings screen. This must be done from the settings screen while the operation monitoring application is running.
This section explains the following setting operations. Please perform the following operations while both Panel Server and Panel Browser are running online.
•Operational status collection settings
•Operation status monitor settings
For details on how to operate each screen, please refer to "Operation monitoring setting registration".
Display the operation monitoring settings registration screen and select "Equipment Registration" from the left menu.
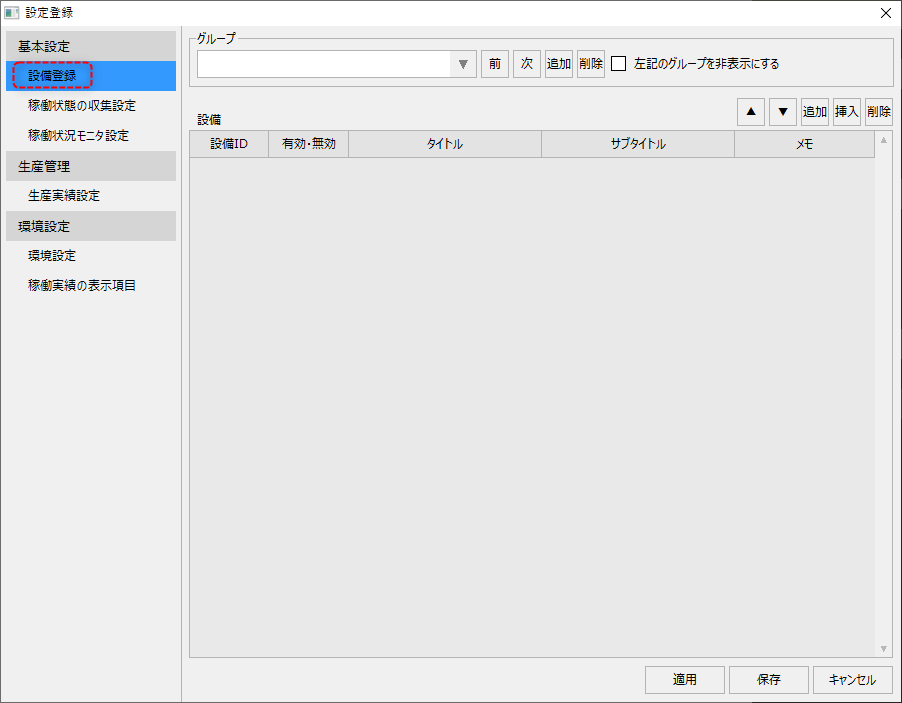
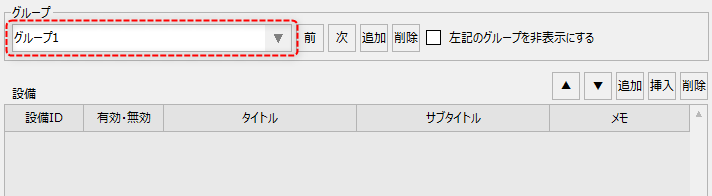
In the initial state, no groups have been registered yet, so please add one group first.
You can name the group anything you like. Here, we will call it "Group 1" as an example.
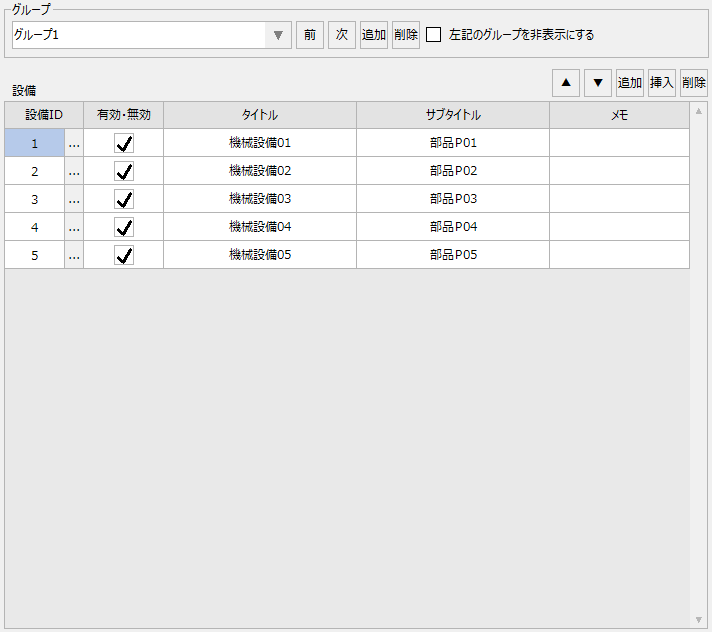
After adding the group, please register the equipment. The equipment to be registered should be the following five pieces of equipment, according to the operation monitoring design that was considered in advance.
Once you have finished entering the information, click the "Apply" button.
|
|
In the following steps, click the "Apply" or "Save" button each time you finish entering information. If you want to continue setting up the system, click "Apply" to keep the setting screen displayed.
Next, select "Operation status collection settings" from the left menu on the setting registration screen.
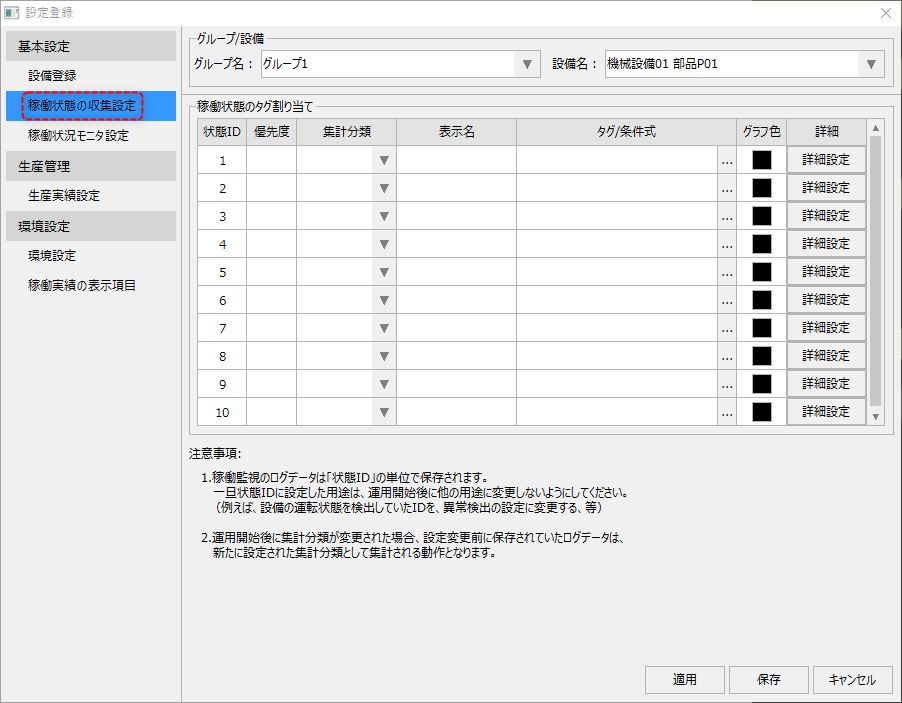
From this screen, you can register the operating status and assign tags.
First, make the settings for Machinery 01. Make sure "Machinery 01" is selected as the target equipment.
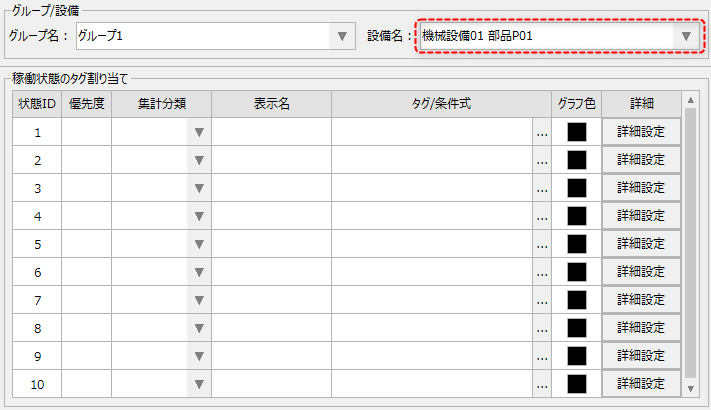
Please register the following information for Machinery Equipment 01. You can freely change the display color, etc.
Priority |
Aggregation Classification |
display name |
Tags/Conditions |
Graph Color |
Advanced settings (example) |
||
2 |
Operation |
While driving |
U01.F01.X0000 |
(No change) |
|
||
1 |
Out of Operation |
Suspended |
U01.F01.X0001 |
(No change) |
|
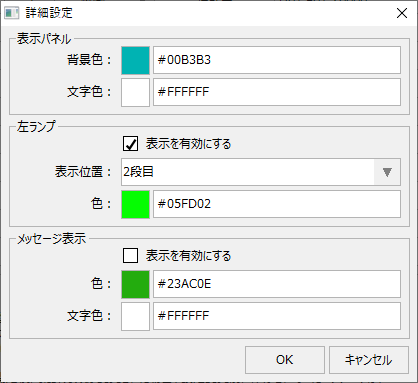
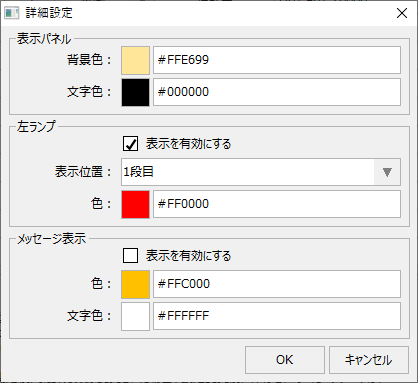
(Example of machine equipment 01 settings)
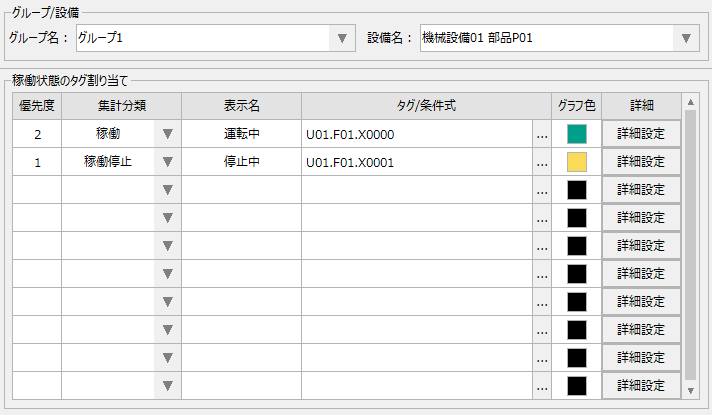
After setting up Machine Equipment 01, please set up the other equipment (Machine Equipment 02, 03, 04, 05) in the same way.
Operation status monitor settings
Next, select "Operation Status Monitor Settings" from the left menu on the setting registration screen.
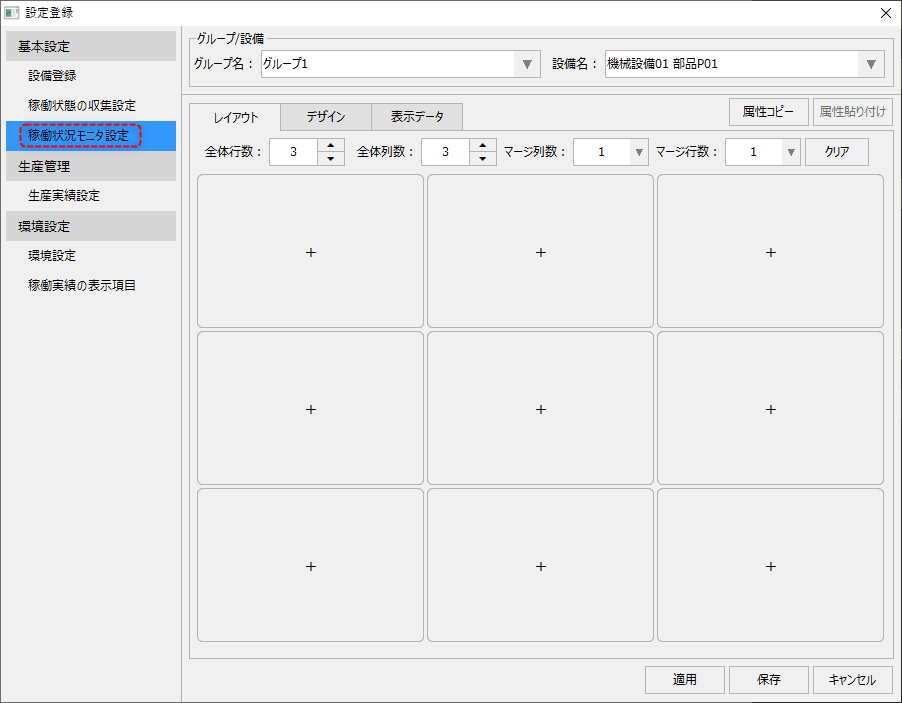
■ Layout settings
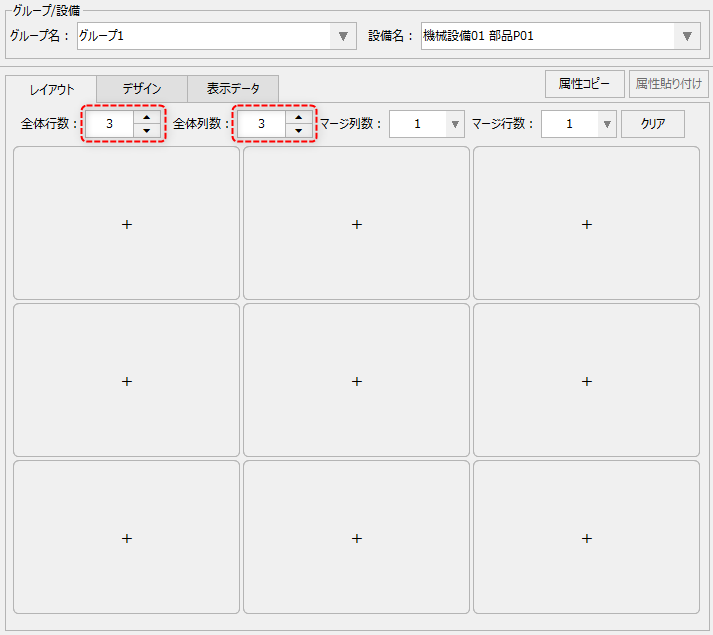
First, set the total number of rows and columns in the Layout tab.
This setting is done on a group basis.
|
In this example, we'll leave it at the default.
Total number of lines: 3 Total number of columns: 3
|
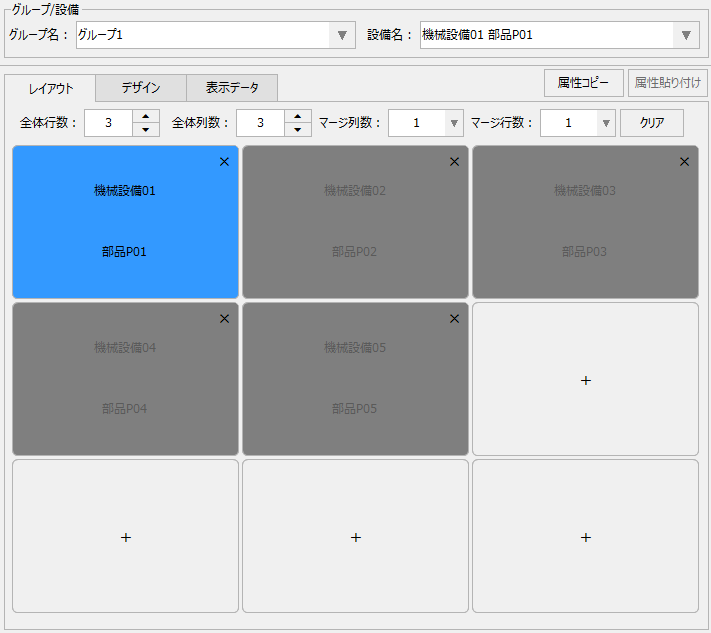
Once you have decided on the number of rows and columns, place the equipment in the layout frame. As an example, place all the equipment in order starting from the top left equipment.
|
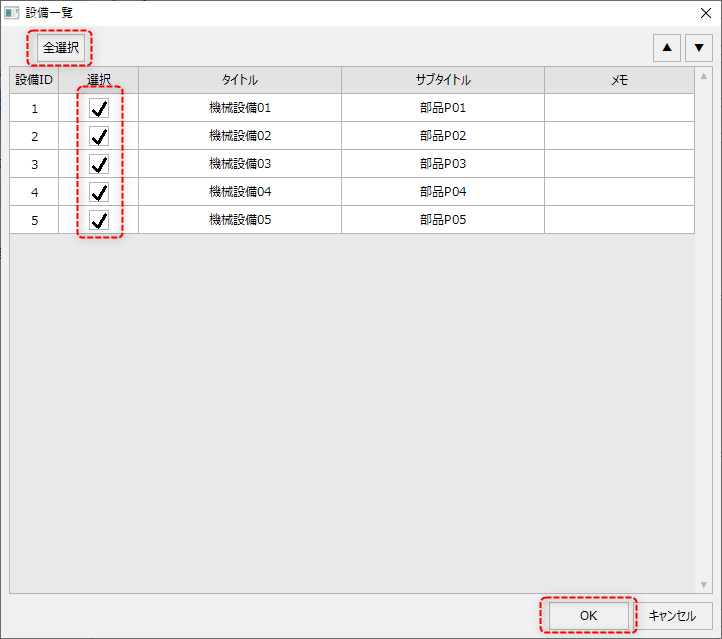
Furthermore, when placing multiple facilities at once, you can select all the check boxes at once by clicking the "Select All" button in the facility selection dialog.
|
■ Design settings
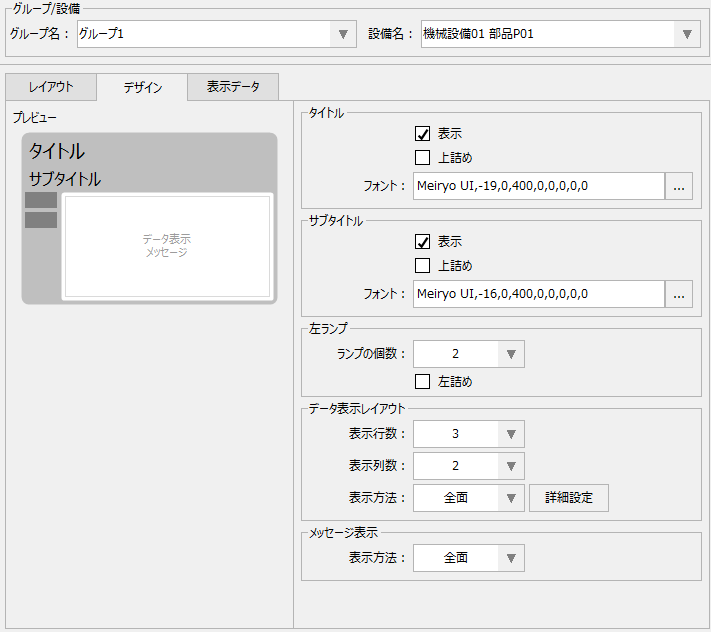
Next, from the Design tab, set the display frame design.
This setting must be done on a per-equipment basis. First, set it for "Machine Equipment 01" (*For other equipment, you can easily expand it later using the attribute copy function).
|
Left lamp: •Number of lamps:Change to 2
Data display layout: Leave as default •Number of display lines: 3 •Number of display columns: 2 •Display method: Full screen
Message display: Leave as default •Display method: Full screen
You can freely change the font size and other settings. |
■ Display data settings
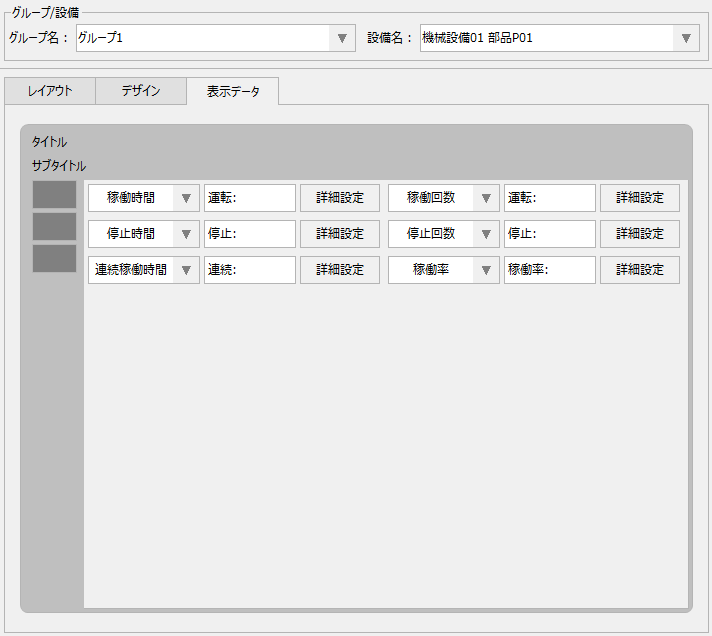
Next, from the Display Data tab, assign the data display position and display items.
This setting must be done on a per-equipment basis. First, set it for "Machine Equipment 01" (*For other equipment, you can easily expand it later using the attribute copy function).
|
Furthermore, settings such as font size and display position can be freely changed from the detailed settings. If you specify long characters for the label display and they are cut off, try fine-tuning the display position or size.
|
■ Copy settings
Copy the settings made for machine equipment 01 to other equipment.
Open the Layout tab, select Mechanical Equipment 01, and click the "Copy Attributes" button at the top of the screen.
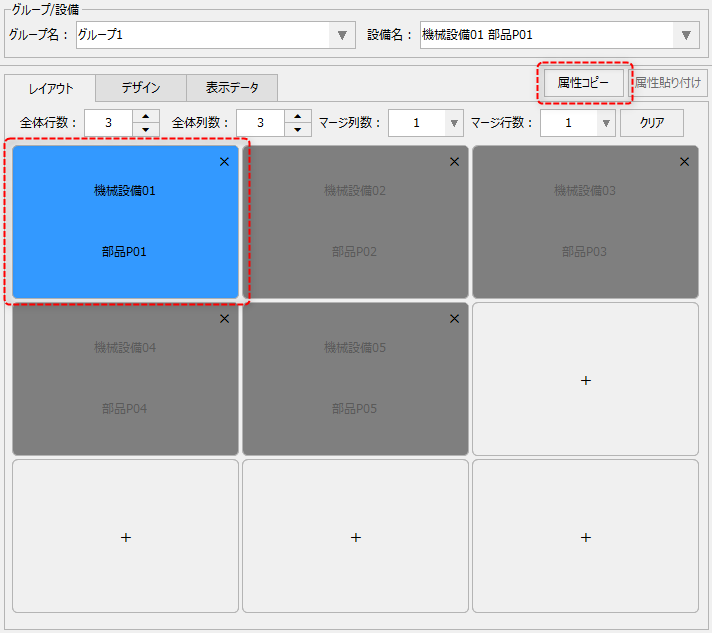
Select the equipment to paste to (in this case, "Machine 02") and click the "Paste Attributes" button at the top of the screen. This will paste the display attributes of the equipment you just copied.
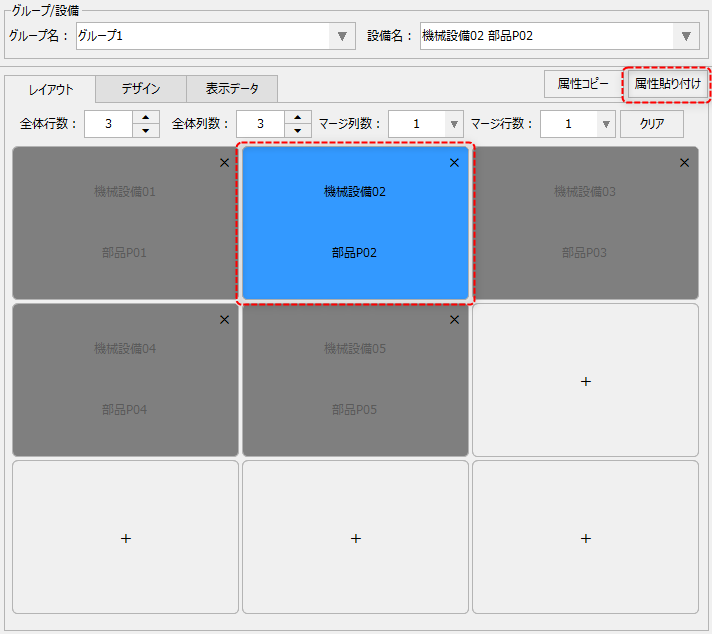
Using the same procedure, paste the settings for Machinery 03, 04, and 05.
The copy button will retain the last copied state. If you do not need to change the copied source, simply select the next facility and click the paste button again.
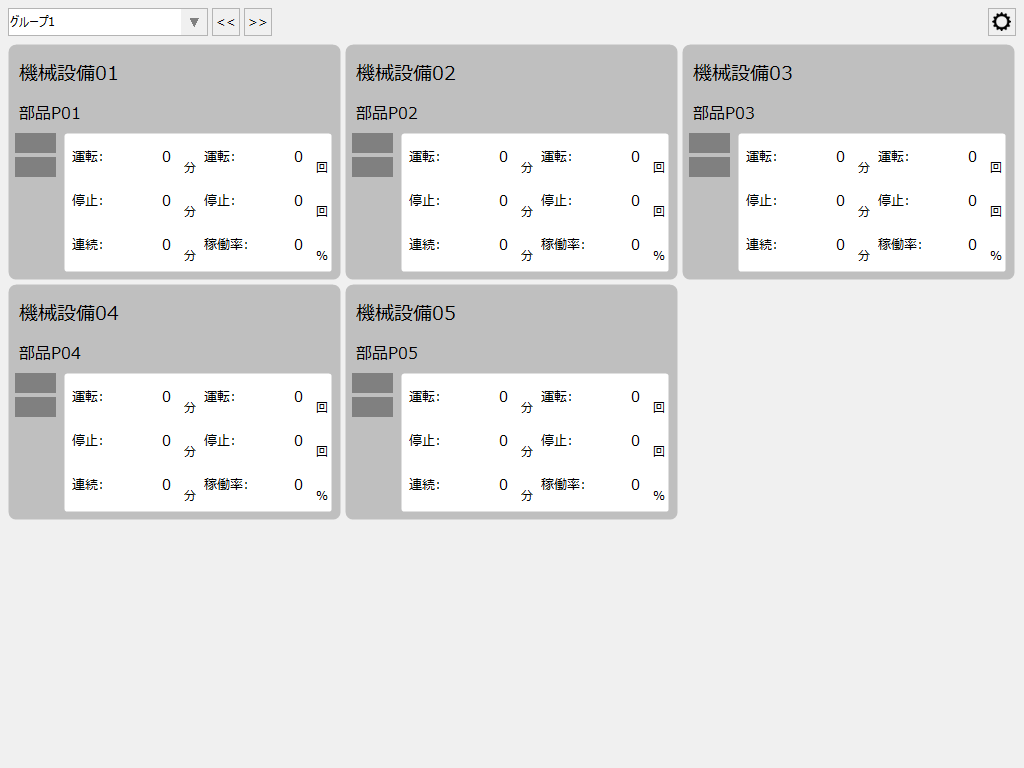
When you display the operation status monitor screen, it will look like this:
|
The five facilities registered on the settings screen are displayed.
Currently, the operation and stop tags for all of the equipment are OFF, so they are displayed in gray as shown on the left.
|
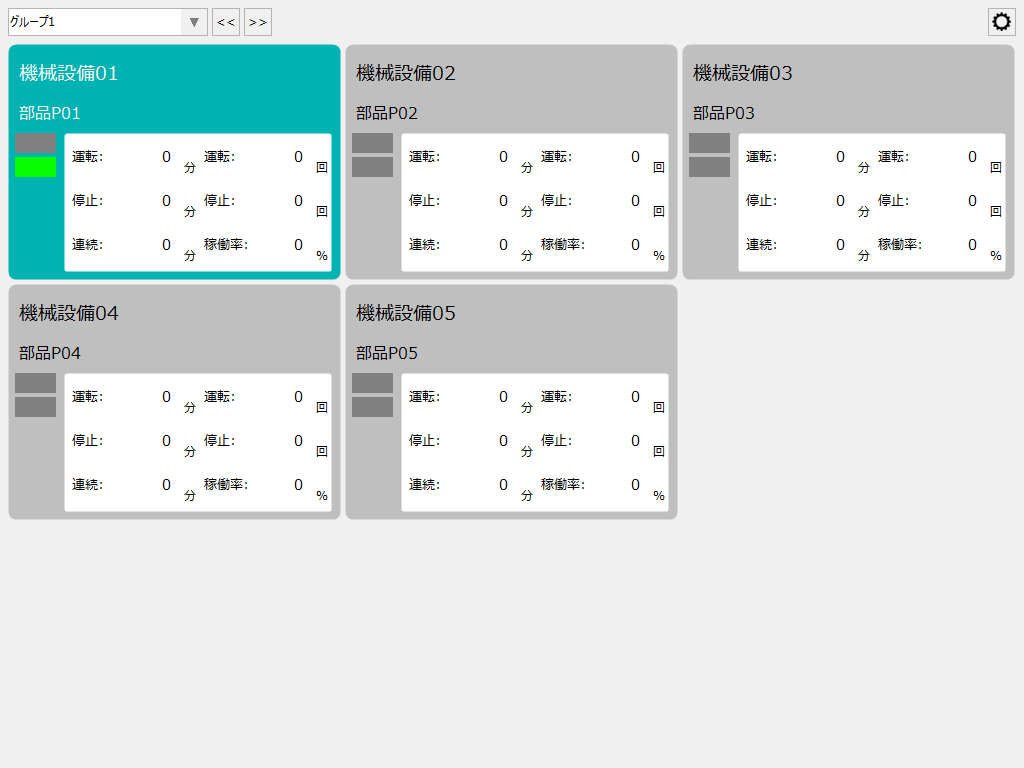
Let's turn on the operating tag (U01.F01.X0000) for Machinery 01.
|
Then the screen display will look like the one shown on the left.
•Left lamp: 2nd row green light •Display frame: Default background color (light green)
The operation status monitor screen updates every minute. If you leave the operation tag turned on for a while, the operation time and operation rate display will change as follows:
|
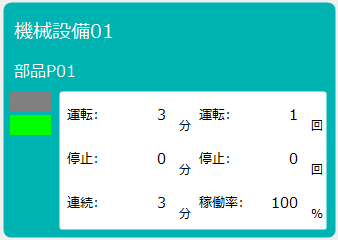
Next, turn ON the stopped tag (U01.F01.X0001) of machine equipment 01 and turn OFF the operating tag (U01.F01.X0000).
|
Then, the display for Machinery 01 will look like the image on the left.
•Left lamp: Red light on the first level •Display frame: Default background color (light yellow)
Furthermore, if the stop tag is left ON for a while, the display of the stop time and operating rate will change as follows:
|
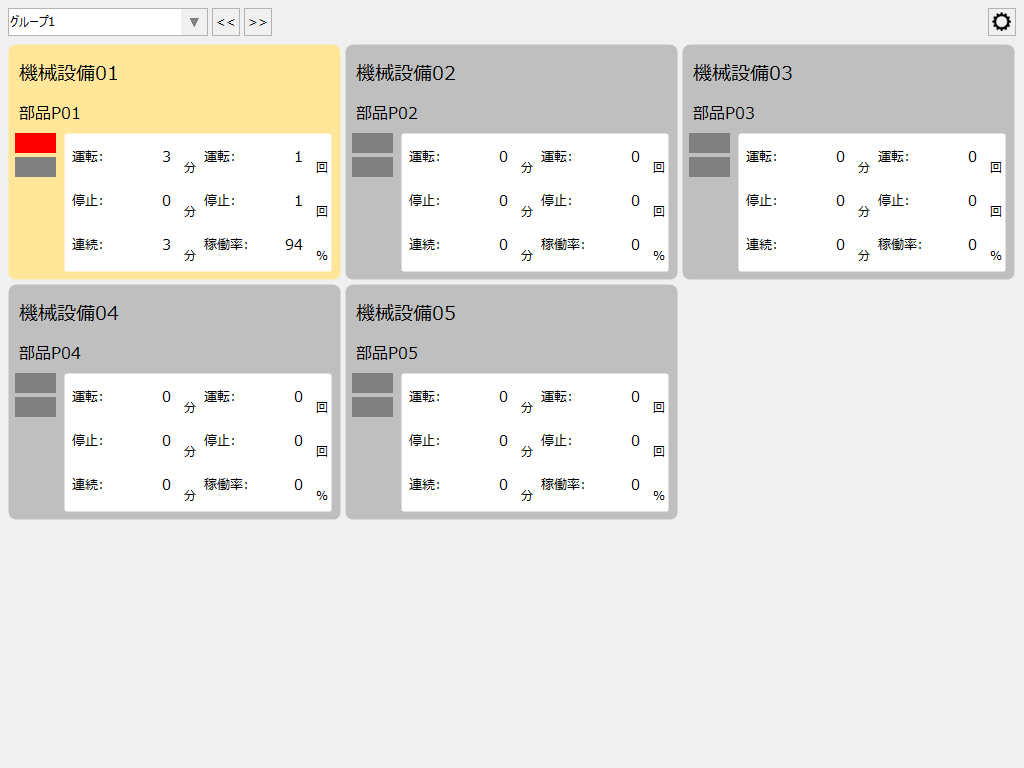
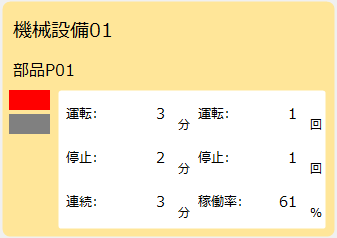
Try turning the values of the Operating tag and Stopped tag ON/OFF as described above and checking various operations.
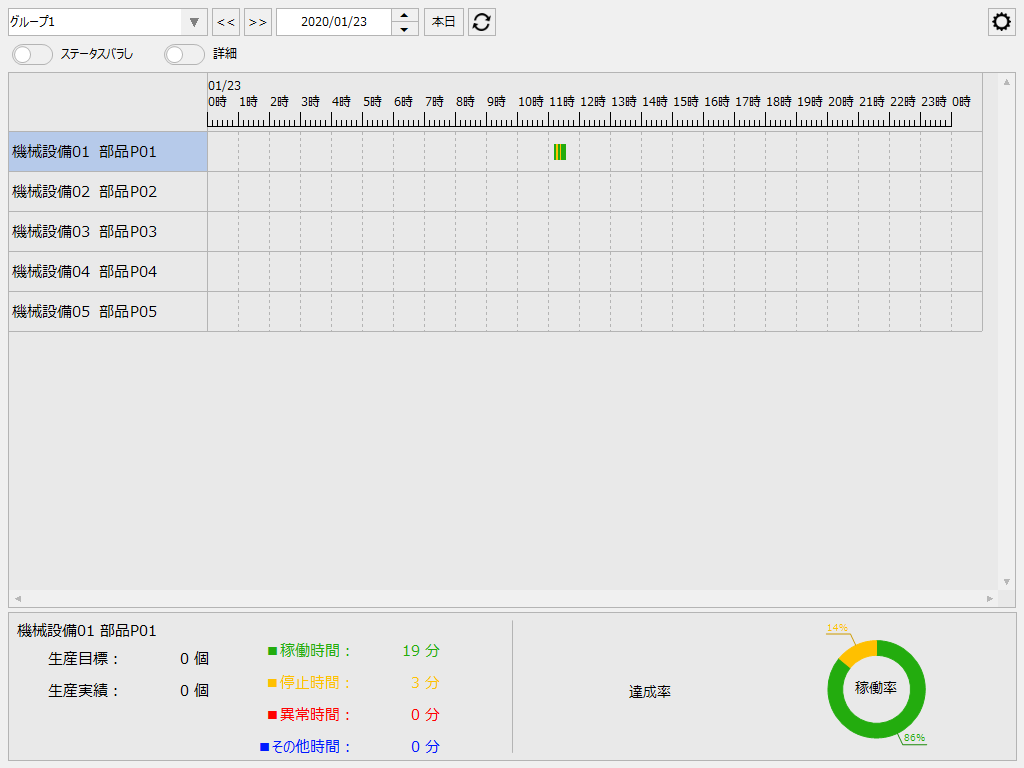
The following is an example of the timeline screen.
|
You can see that the values are reflected in the operating time and stoppage time of Machine 01.
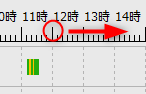
By default, 24 hours of data is displayed on one screen, but you can enlarge the displayed data by dragging the time portion of the timeline with the mouse.
(Enlarged display example)
|
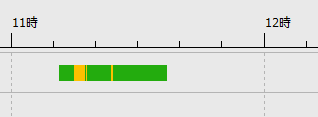
The following is an example of the operation results screen.
|
You can see that values are reflected in the operating time, stoppage time, number of operations, number of stops, operating rate, etc. of Machinery 01.
In addition, the display items displayed in the list of operation results can be freely changed from the settings screen. For details, please refer to "Setting the display items of operation results".
|
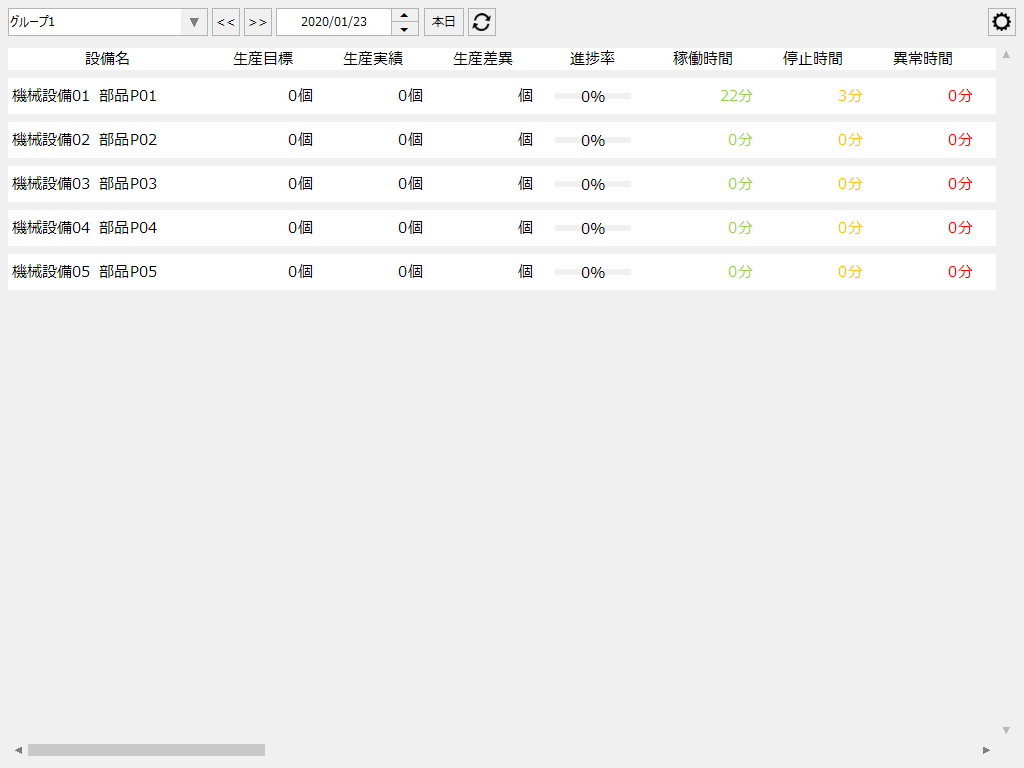
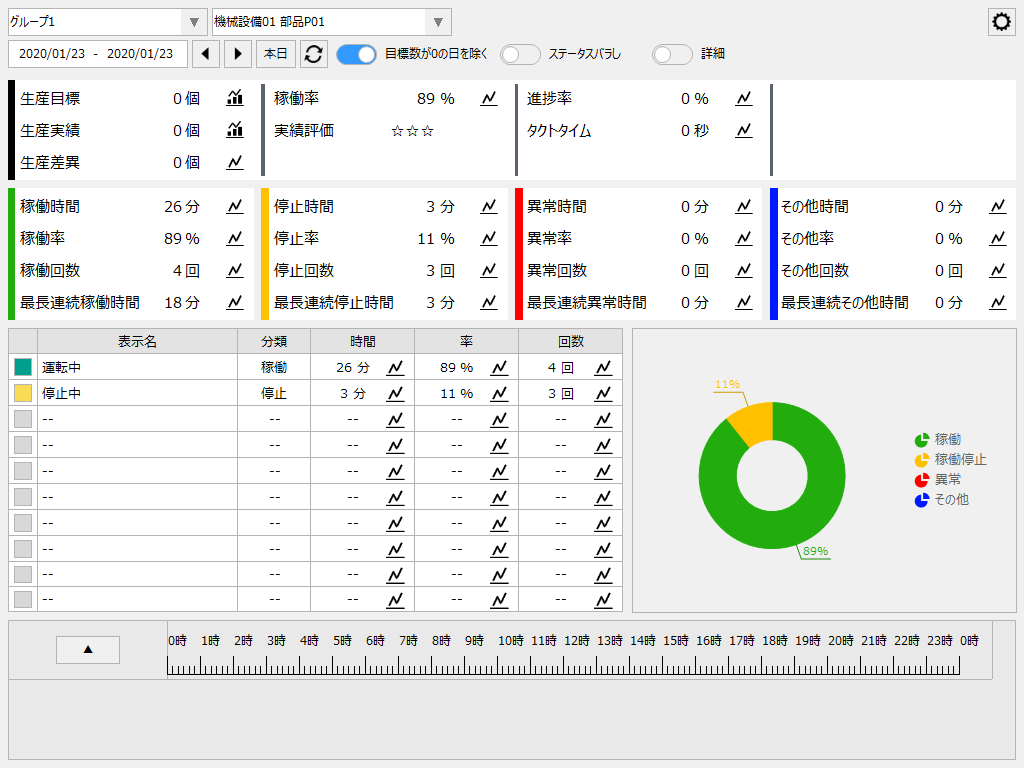
The following is an example of the operation analysis screen.
|
You can see that the values are reflected in the operating time, stop time, and operating rate of Machinery 01.
In addition, information such as production target, production results, progress rate, and takt time will remain at zero because production results are not set to be imported. Similarly, abnormal time and other time will not change because the corresponding aggregation classification signal has not been registered.
|