Once you have registered the tag, you can configure the various settings from the operation monitoring settings screen. This must be done from the settings screen while the operation monitoring application is running.
This section explains the following setting operations. Please perform the following operations while both Panel Server and Panel Browser are running online.
•Operational status collection settings
•Operation status monitor settings
•Production performance settings
For details on how to operate each screen, please refer to "Operation monitoring setting registration".
Display the operation monitoring settings registration screen and select "Equipment Registration" from the left menu.
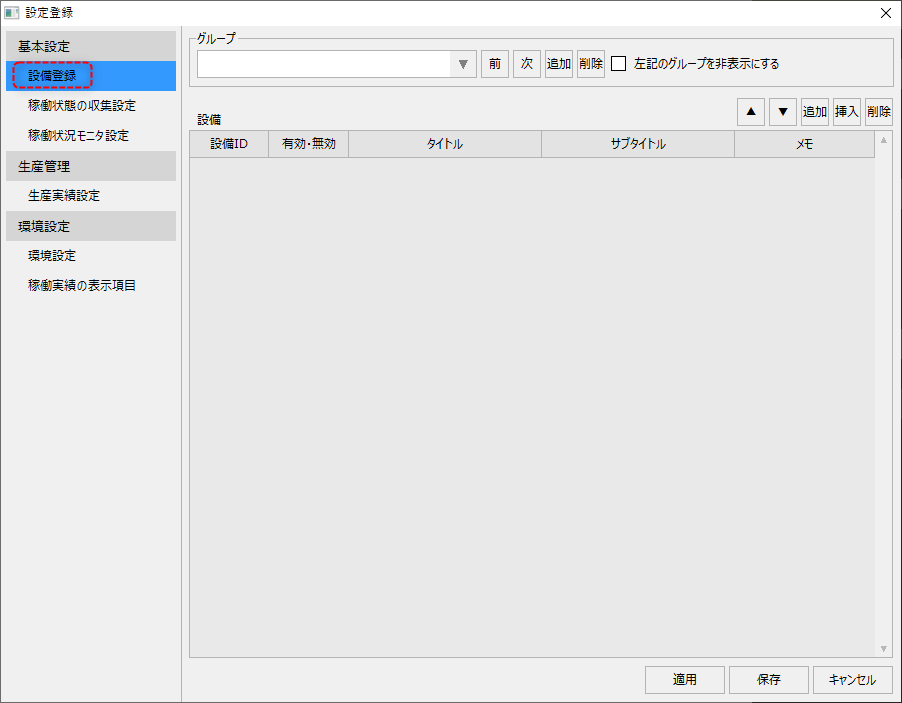
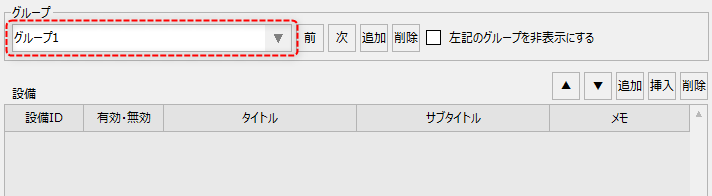
In the initial state, no groups have been registered yet, so please add one group first.
You can name the group anything you like. Here, we will call it "Group 1" as an example.
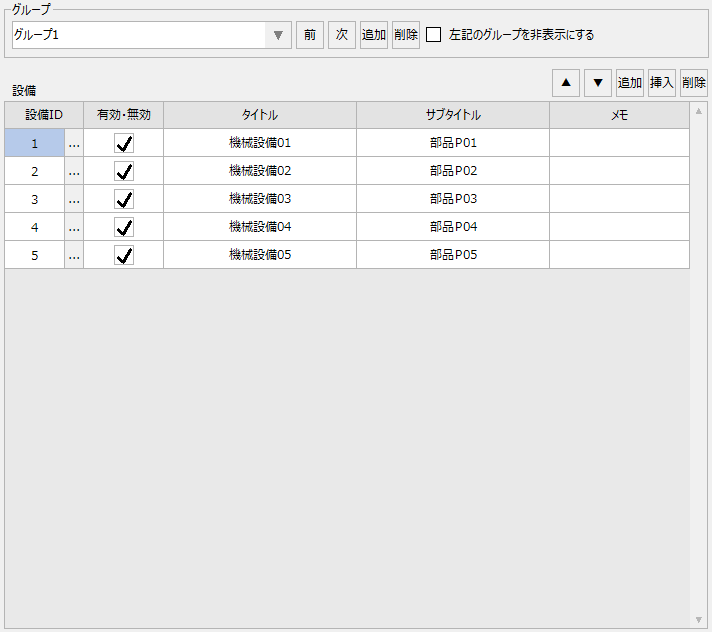
After adding the group, please register the equipment. The equipment to be registered should be the following five pieces of equipment, according to the operation monitoring design that was considered in advance.
Once you have finished entering the information, click the "Apply" button.
|
|
In the following steps, click the "Apply" or "Save" button each time you finish entering information. If you want to continue setting up the system, click "Apply" to keep the setting screen displayed.
Next, select "Operation status collection settings" from the left menu on the setting registration screen.
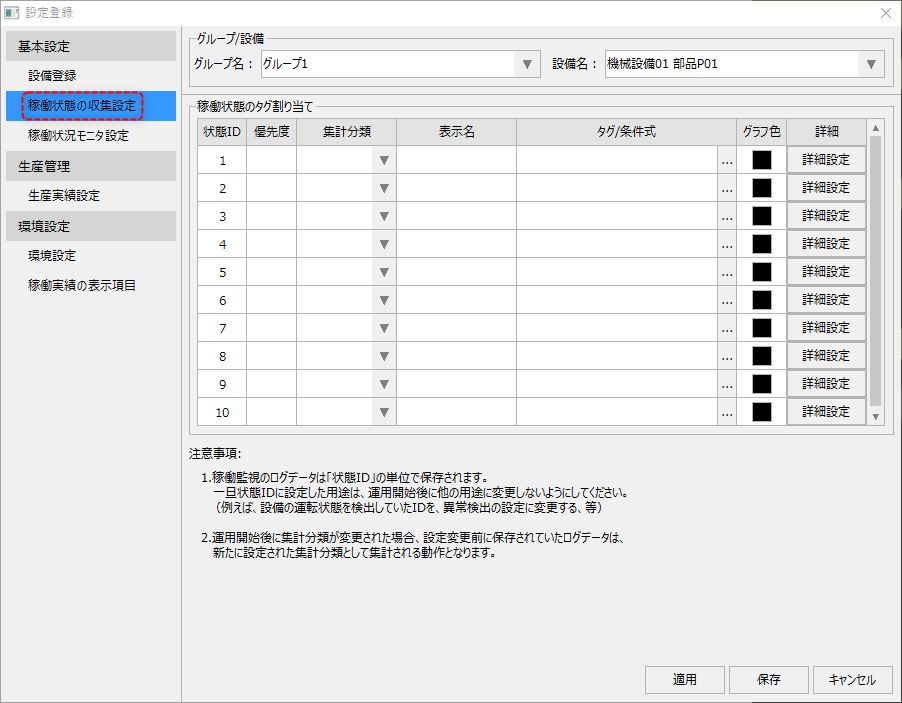
From this screen, you can register the operating status and assign tags.
First, make the settings for Machinery 01. Make sure "Machinery 01" is selected as the target equipment.
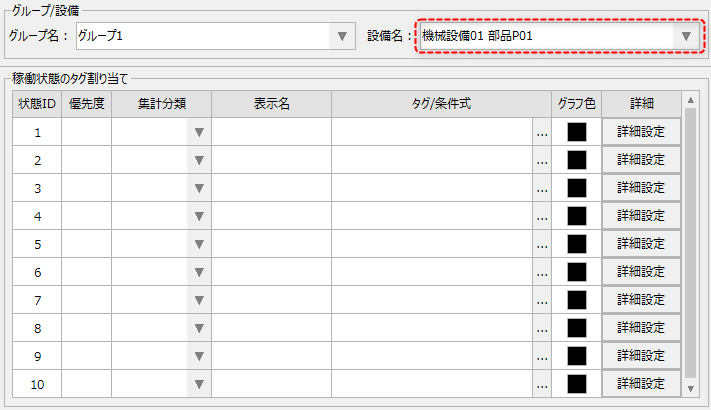
Please register the following information for Machinery Equipment 01. You can freely change the display color, etc.
Priority |
Aggregation Classification |
display name |
Tags/Conditions |
Graph Color |
Advanced settings (example) |
||
5 |
Operation |
While driving |
U01.F01.X0000 |
(No change) |
|
||
4 |
Out of Operation |
Suspended |
U01.F01.X0001 |
(No change) |
|
||
3 |
Abnormal |
breakdown |
U01.F01.X0002 |
(No change) |
|
||
2 |
Abnormal |
call |
U01.F01.X0003 |
(No change) |
|
||
1 |
Abnormal |
Under treatment |
U01.F01.X0004 |
(No change) |
|
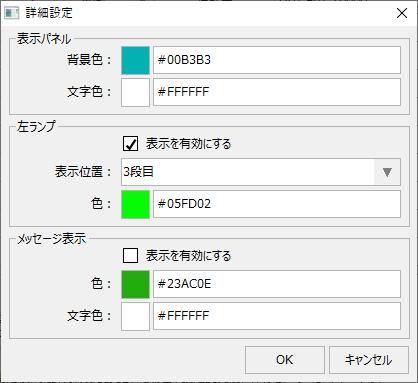
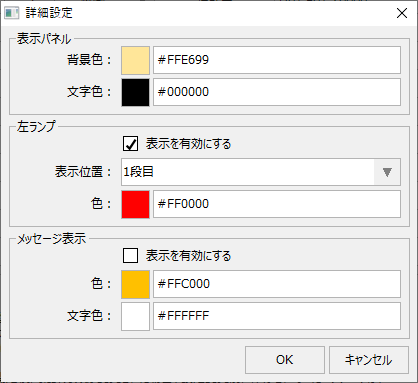
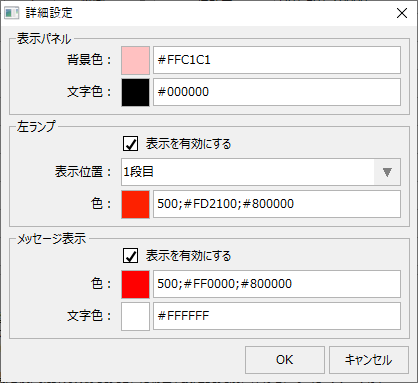
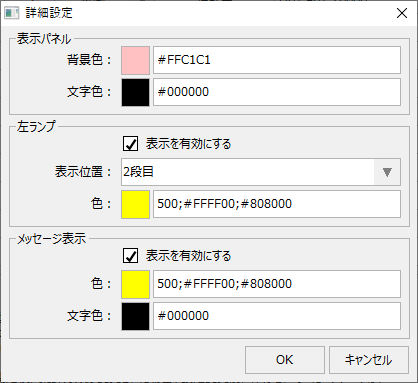
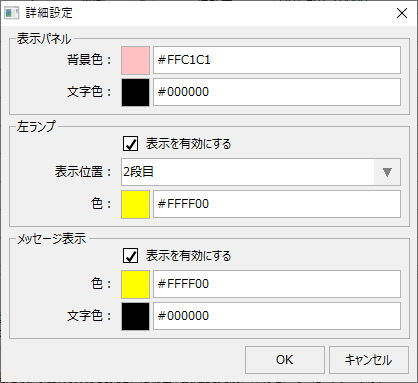
(Example of machine equipment 01 settings)
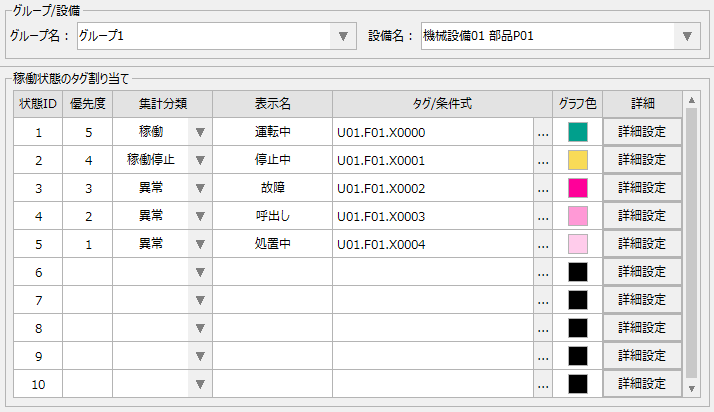
After setting up Machine Equipment 01, please set up the other equipment (Machine Equipment 02, 03, 04, 05) in the same way.
Operation status monitor settings
Next, select "Operation Status Monitor Settings" from the left menu on the setting registration screen.
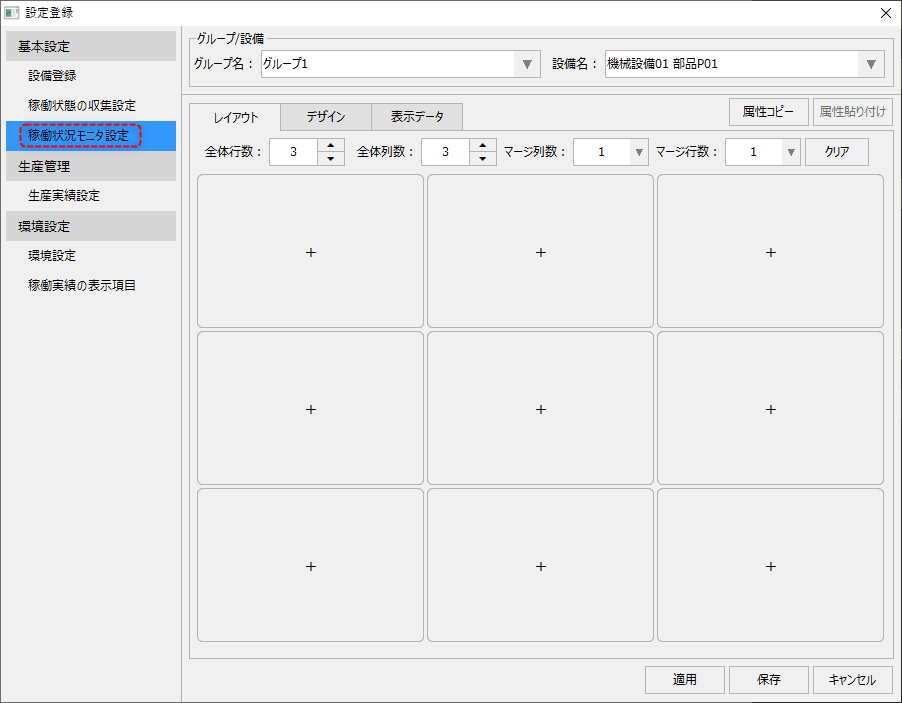
■ Layout settings
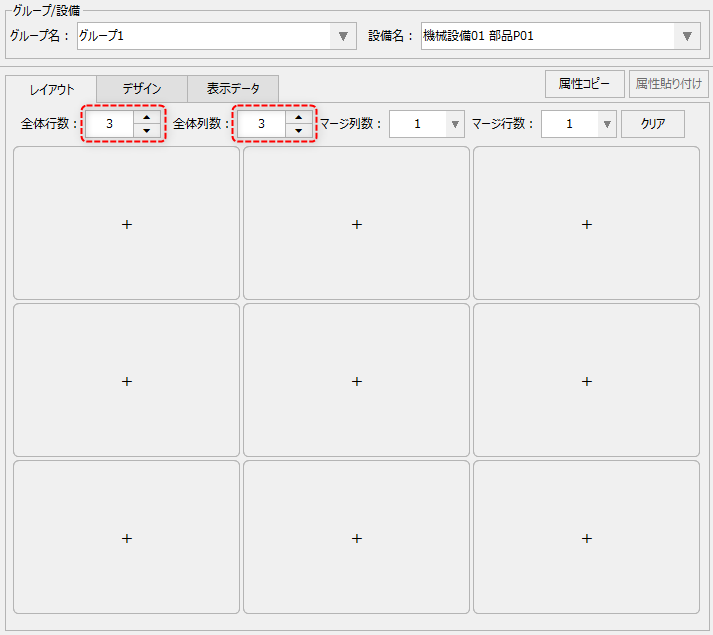
First, set the total number of rows and columns in the Layout tab.
This setting is done on a group basis.
|
In this example, we'll leave it at the default.
Total number of lines: 3 Total number of columns: 3
|
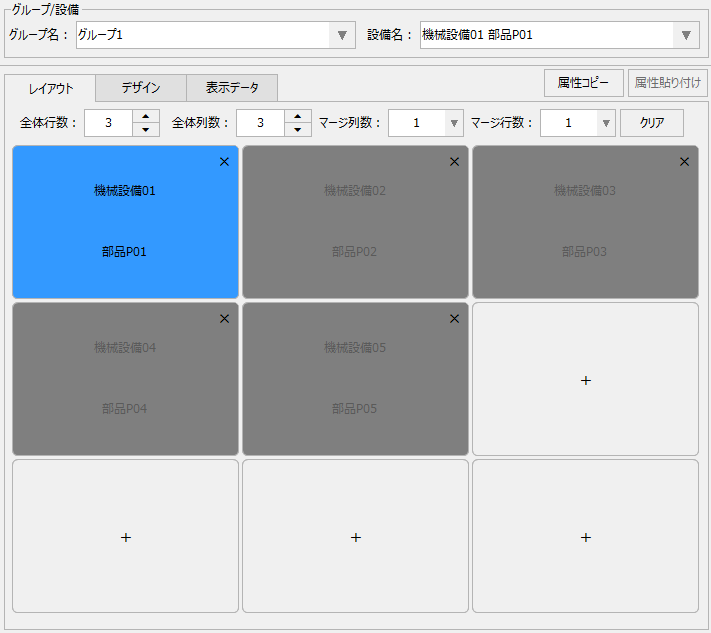
Once you have decided on the number of rows and columns, place the equipment in the layout frame. As an example, place all the equipment in order starting from the top left equipment.
|
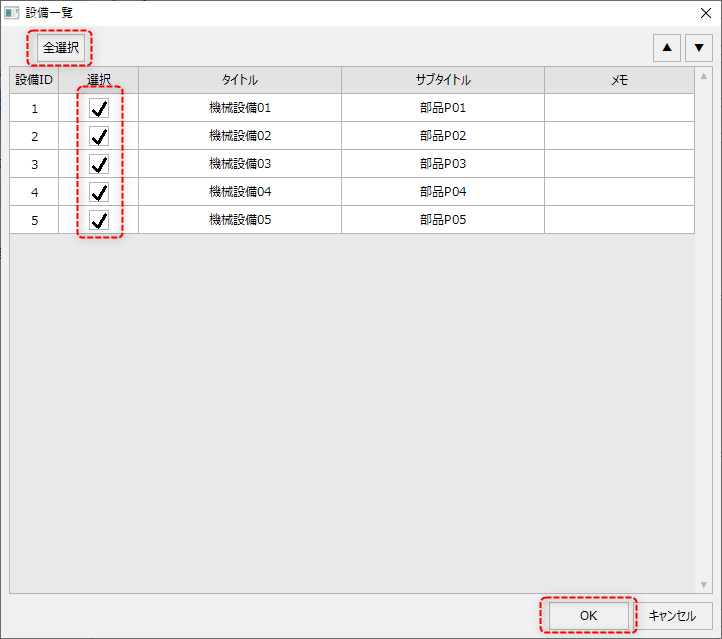
Furthermore, when placing multiple facilities at once, you can select all the check boxes at once by clicking the "Select All" button in the facility selection dialog.
|
■ Design settings
Next, from the Display Data tab, assign the data display position and display items.
This setting must be done on a per-equipment basis. First, set it for "Machine Equipment 01" (*For other equipment, you can easily expand it later using the attribute copy function).
|
You can freely change the font size and other settings. In this example, we'll leave it at the default.
Left lamp: Leave as default •Number of lamps: 3
Data display layout: Leave as default •Number of display lines: 3 •Number of display columns: 2 •Display method: Full screen
Message display: Leave as default •Display method: Full screen
|
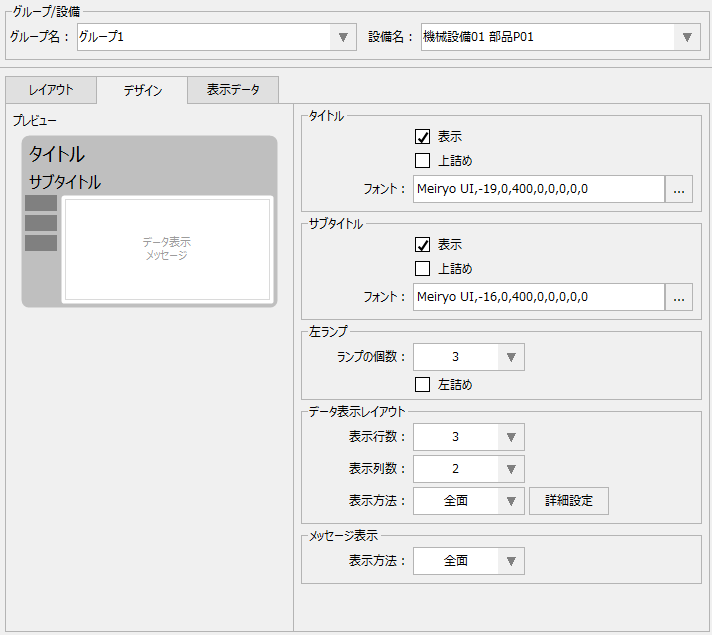
■ Display data settings
Next, from the Display Data tab, assign the data display position and display items.
This setting must be done on a per-equipment basis. First, set it for "Machine Equipment 01" (*For other equipment, you can easily expand it later using the attribute copy function).
|
Settings such as font size and display position can be freely changed from the detailed settings. If you specify long characters for the label display and they are cut off, try fine-tuning the display position or size.
|
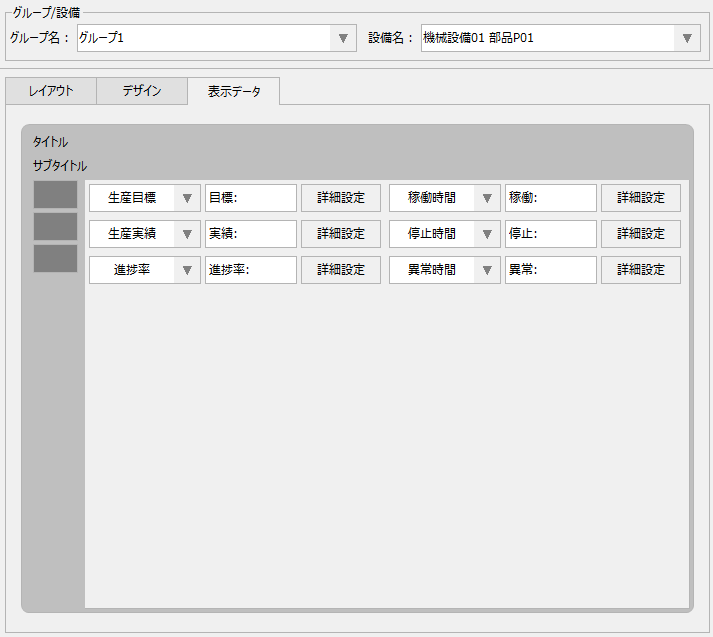
■ Copy settings
Copy the settings made for machine equipment 01 to other equipment.
Open the Layout tab, select Mechanical Equipment 01, and click the "Copy Attributes" button at the top of the screen.
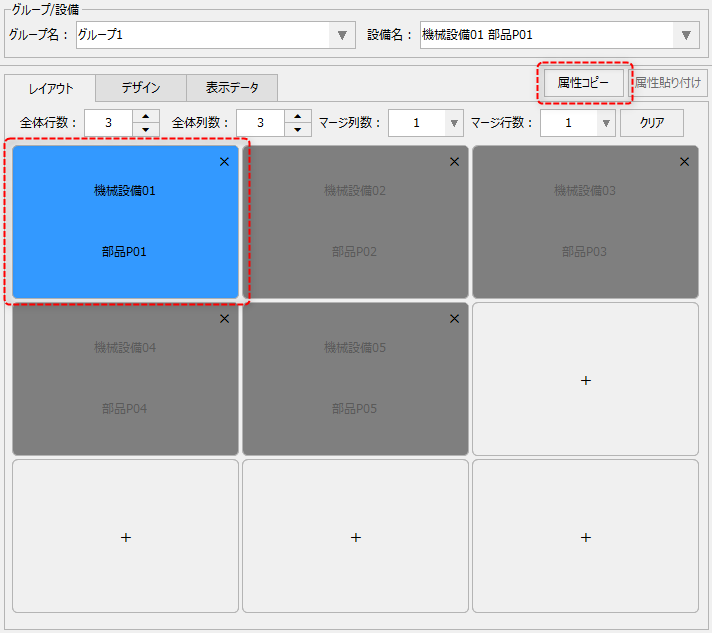
Select the equipment to paste to (in this case, "Machine 02") and click the "Paste Attributes" button at the top of the screen. This will paste the display attributes of the equipment you just copied.
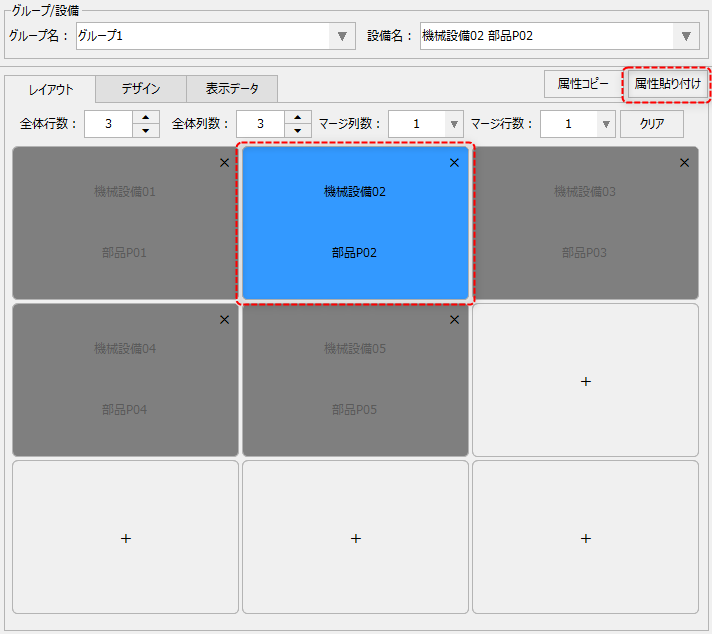
Follow the same procedure to paste the settings for Machinery 03, 04, and 05.
The copy button will retain the last copied state. If you do not need to change the copied source, simply select the next facility and click the paste button again.
Production performance settings
Next, select "Production Record Registration" from the left menu on the setting registration screen.
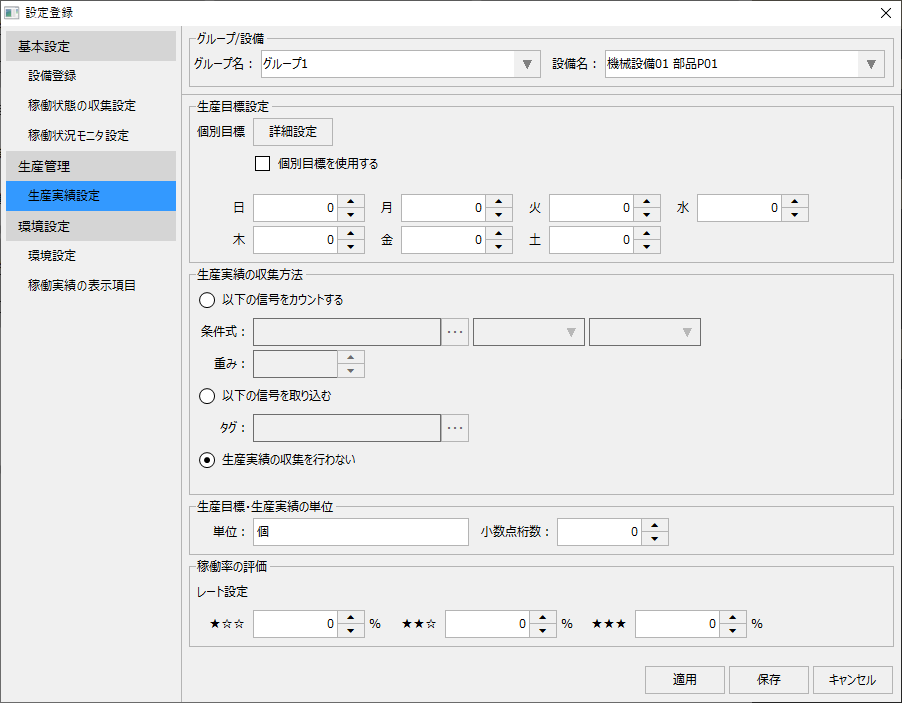
This setting must be done individually for each piece of equipment.
First, make the settings for Machinery 01. Make sure "Machinery 01" is selected as the target equipment.
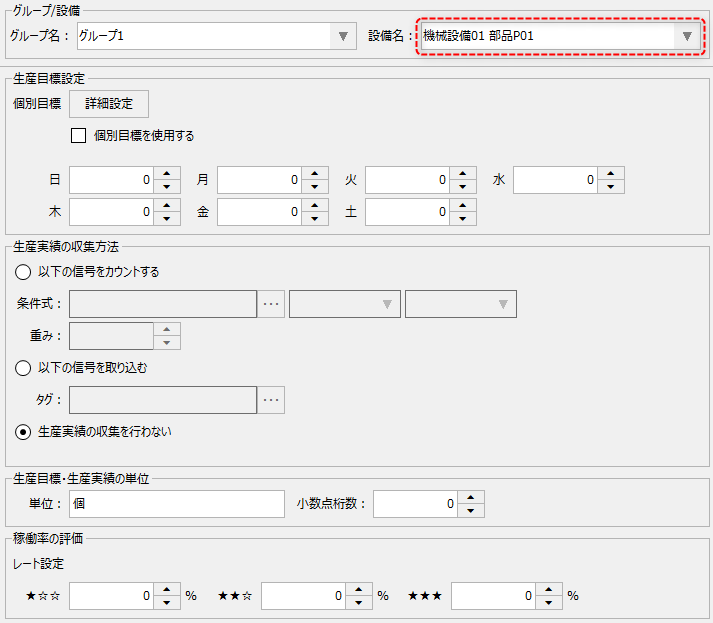
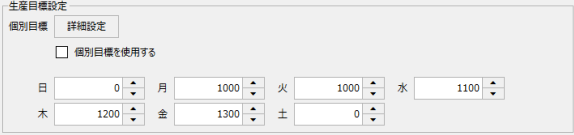
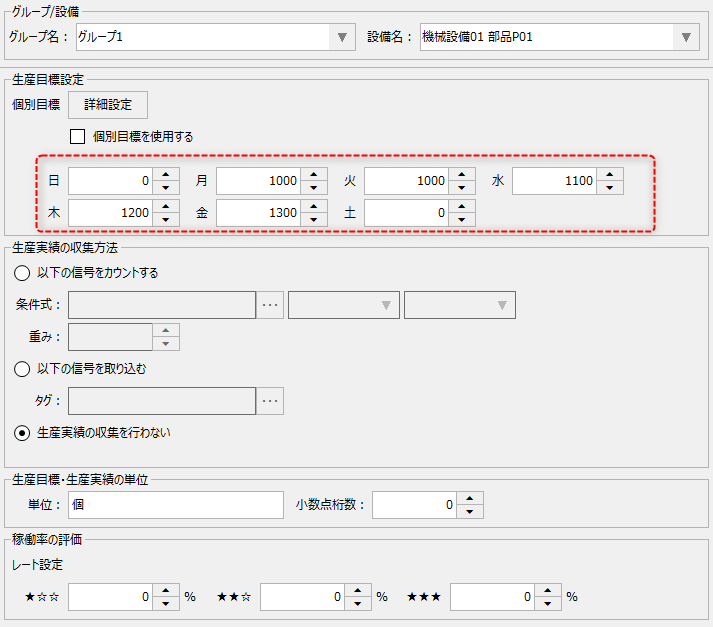
Set the production target. As an example, we will set only the target by day of the week.
|
You can set any target value for the goal. The setting value on the left is an example.
In addition to the weekly goal, you can set individual goals using the calendar. For information on individual goal setting, please refer to "Setting Production Goals".
|
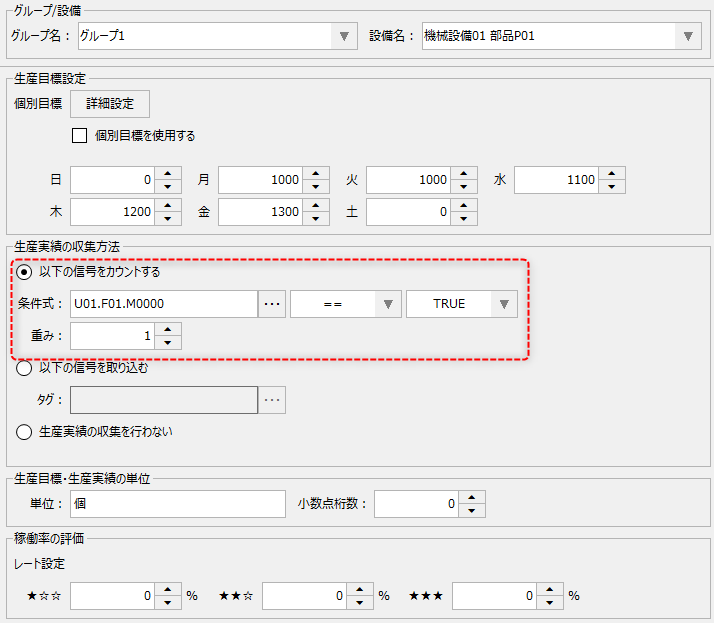
Next, set up how to collect production results.
|
In the production result collection method, select "Count the following signals" and set the condition expression as follows:
U01.F01.M0000 == TRUE
The weight is set to "1".
You can also count the production results quantity at the bottom and set it to receive it as a numerical value. How to set it to receive it as a numerical value is described in "Setting the method for collecting production results".
|
Using the above as reference, please perform the same settings for machinery equipment 02, 03, 04, and 05.
•Machine 02 Production trigger... U01.F01.M0001
•Machine 03 Production trigger... U01.F01.M0002
•Machinery 04 Production trigger... U01.F01.M0003
•Machinery 05 Production trigger... U01.F01.M0004
When you display the operation status monitor screen, it will look like this:
|
The five pieces of equipment registered on the settings screen are displayed. The target value set for each piece of equipment on the corresponding day of the week is displayed.
Currently, all operation status tags are OFF, so they are displayed in gray as shown on the left.
|
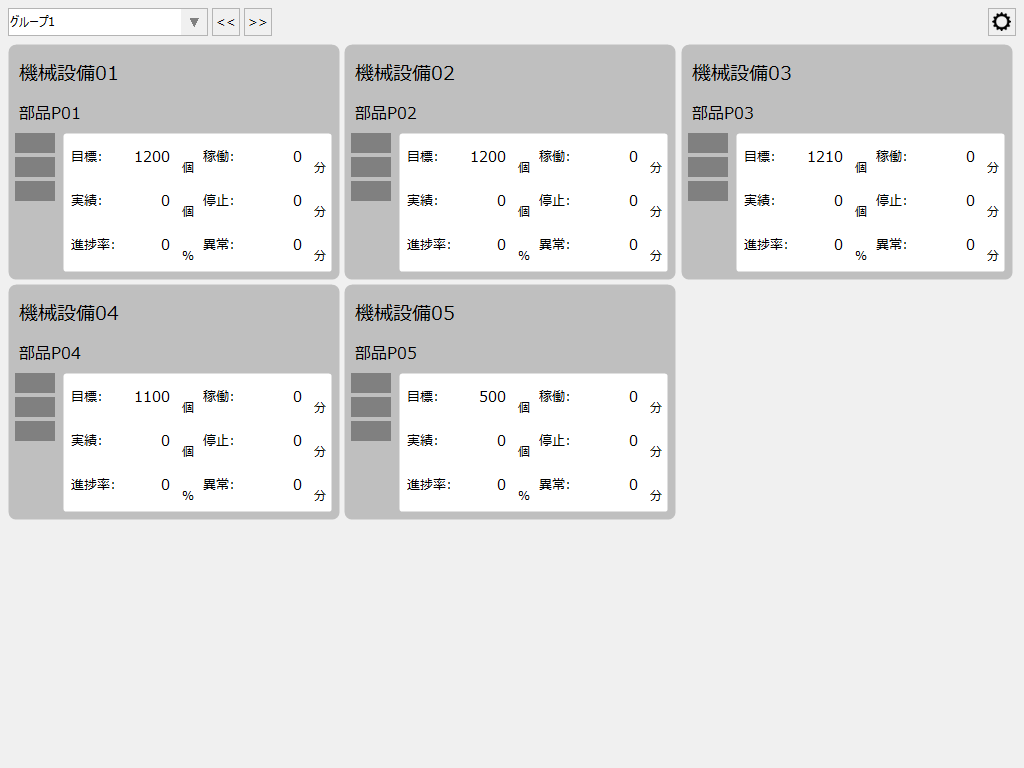
Let's turn on the operating tag (U01.F01.X0000) for Machinery 01.
|
Then the screen display will look like the one shown on the left.
•Left lamp: Green light on the third row •Display frame: Default background color (light green) •No message displayed
In this example setting, messages will not be displayed under normal circumstances, but operating status data will be displayed.
|
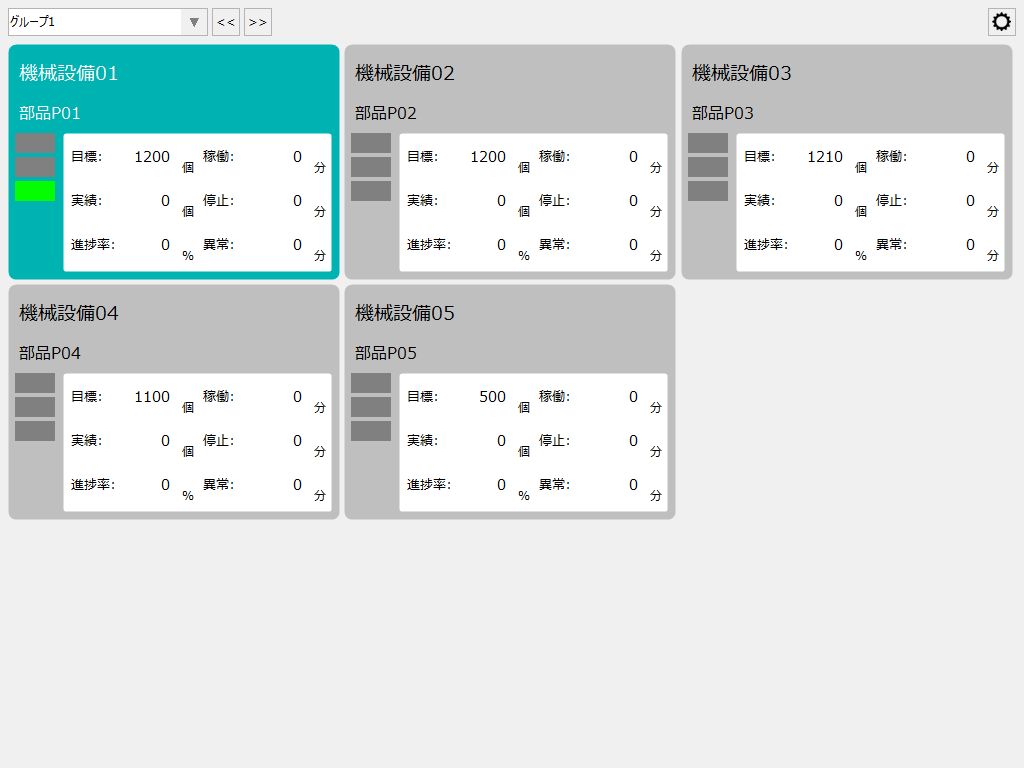
Next, turn ON the stopped tag (U01.F01.X0001) of machine equipment 01 and turn OFF the operating tag (U01.F01.X0000).
|
Then, the display for Machinery 01 will look like the image on the left.
•Left lamp: Red light on the first level •Display frame: Default background color (light yellow) •No message displayed
|
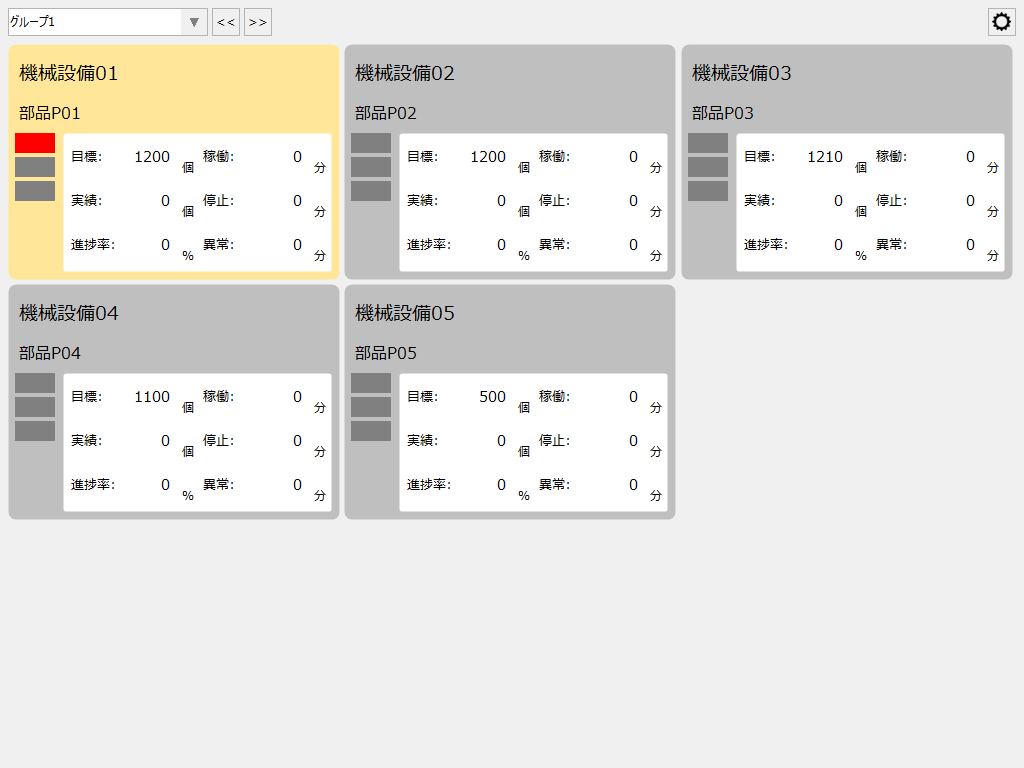
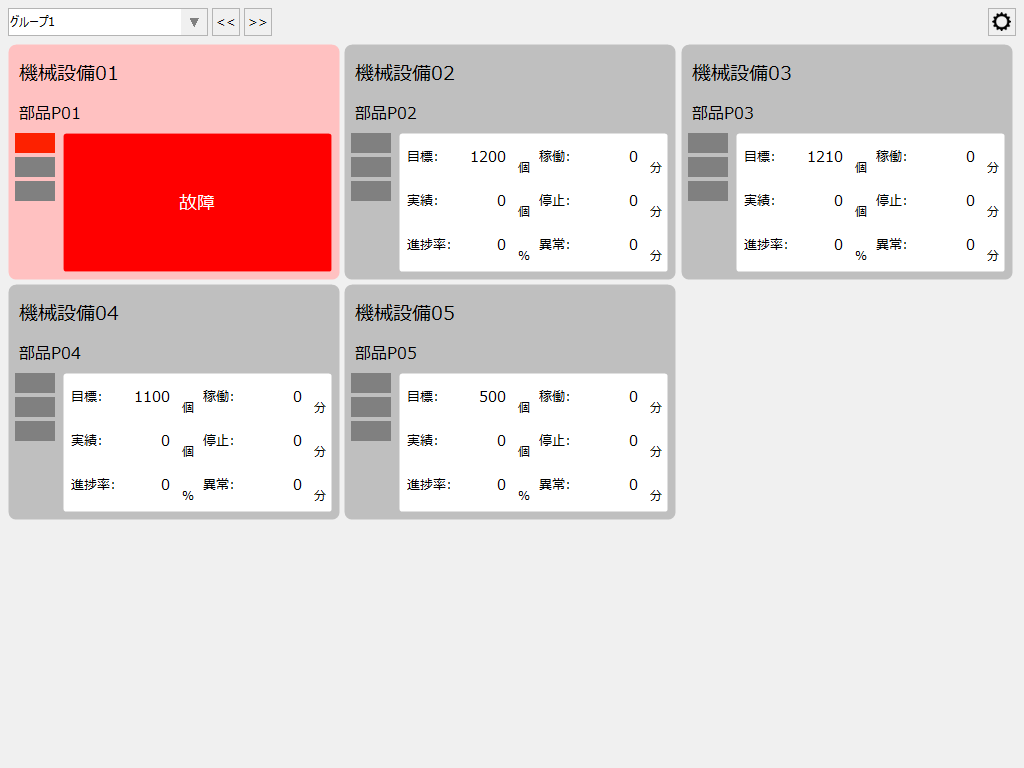
Next, turn ON the fault tag (U01.F01.X0002) for Machinery 01.
|
Then, the display for Machinery 01 will look like the image on the left.
•Left lamp: Flashing red on the first level •Display frame: Default background color (light red) •Message: "Broken"
If a malfunction occurs in the equipment, the left lamp will flash and a flashing message will be displayed in the center to notify you.
|
Next, turn on the call tag for machine equipment 01 (U01.F01.X0003).
|
Then, the display for Machinery 01 will look like the image on the left.
•Left lamp: Second row flashing yellow •Display frame: Default background color (light red) •Message: "Call"
When the call button on the unit is pressed, the left lamp flashes and a message flashes in the center to notify the user. This allows the administrator to know the call request on the screen.
|
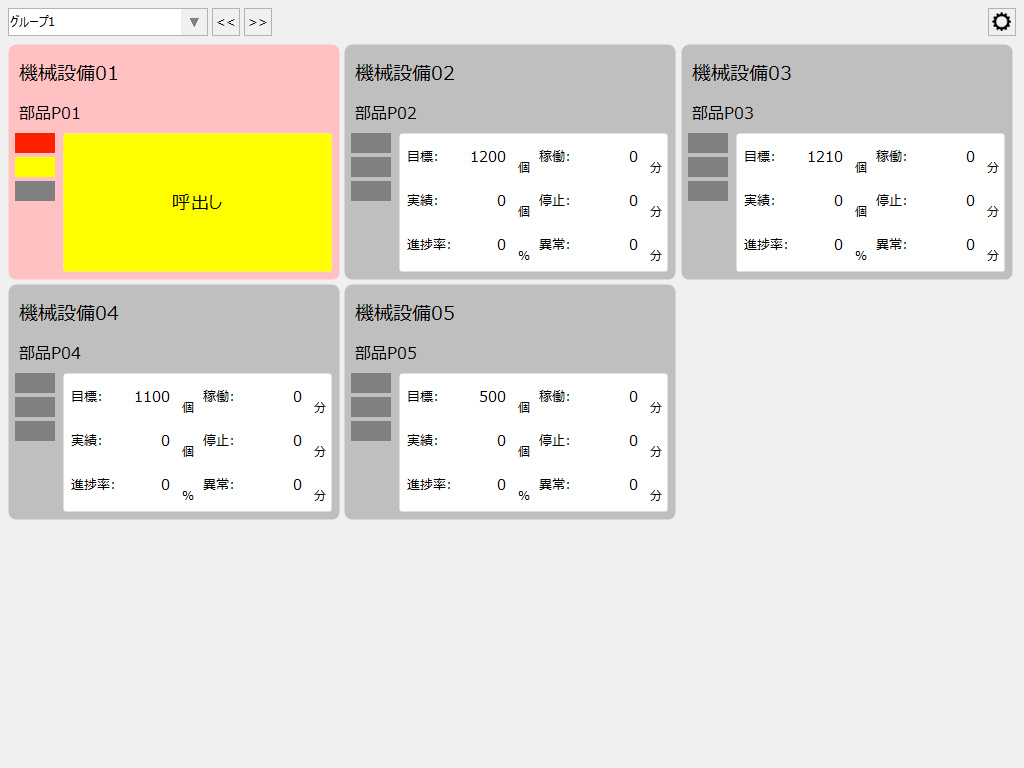
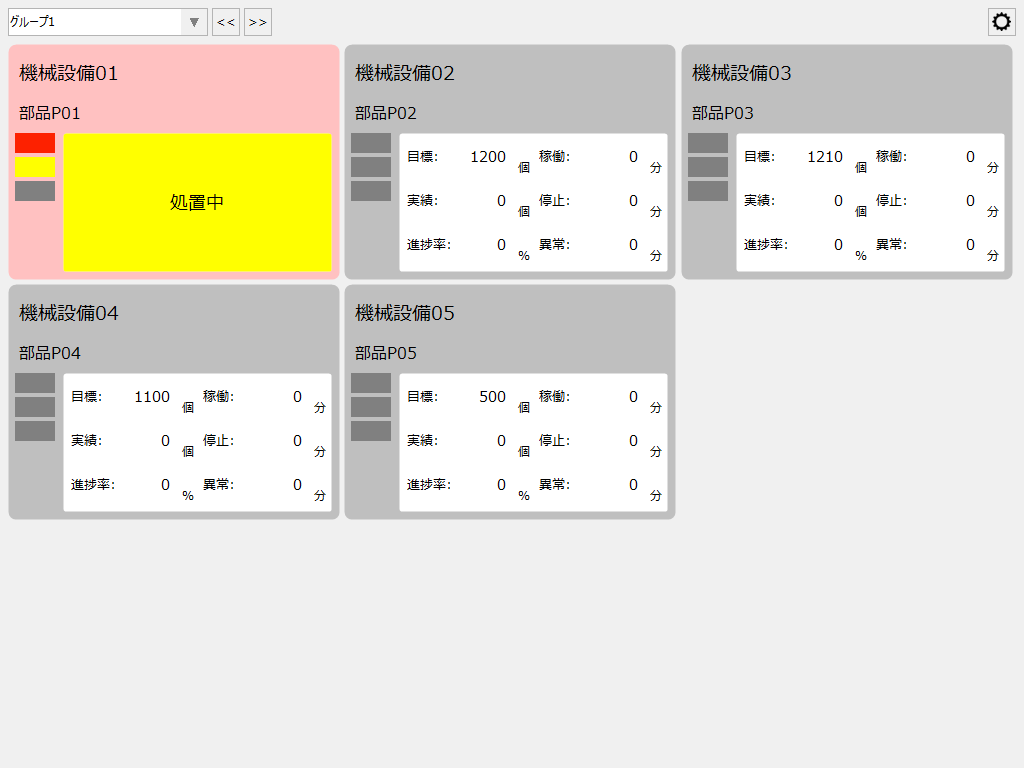
Next, turn ON the processing tag (U01.F01.X0004) for Machinery 01.
|
Then, the display for Machinery 01 will look like the image on the left.
•Left lamp: Yellow light on the second row •Display frame: Default background color (light red) •Message: "Processing"
When the treatment button on the machine is pressed, the left lamp will stop flashing and stay lit, and the message in the center will also stay lit. This will let you know that the on-site staff is taking measures to restore the machine.
|
Once all checks have been completed, turn ON the In Operation tag for Machinery 01 (U01.F01.X0000) and turn OFF the other tags (U01.F01.X0001, U01.F01.X0002, U01.F01.X0003, U01.F01.X0004).
|
Then, the display for Machinery 01 returned to its normal state.
•Left lamp: 1st stage green light •Display frame: Default background color (light green) •No message displayed
|
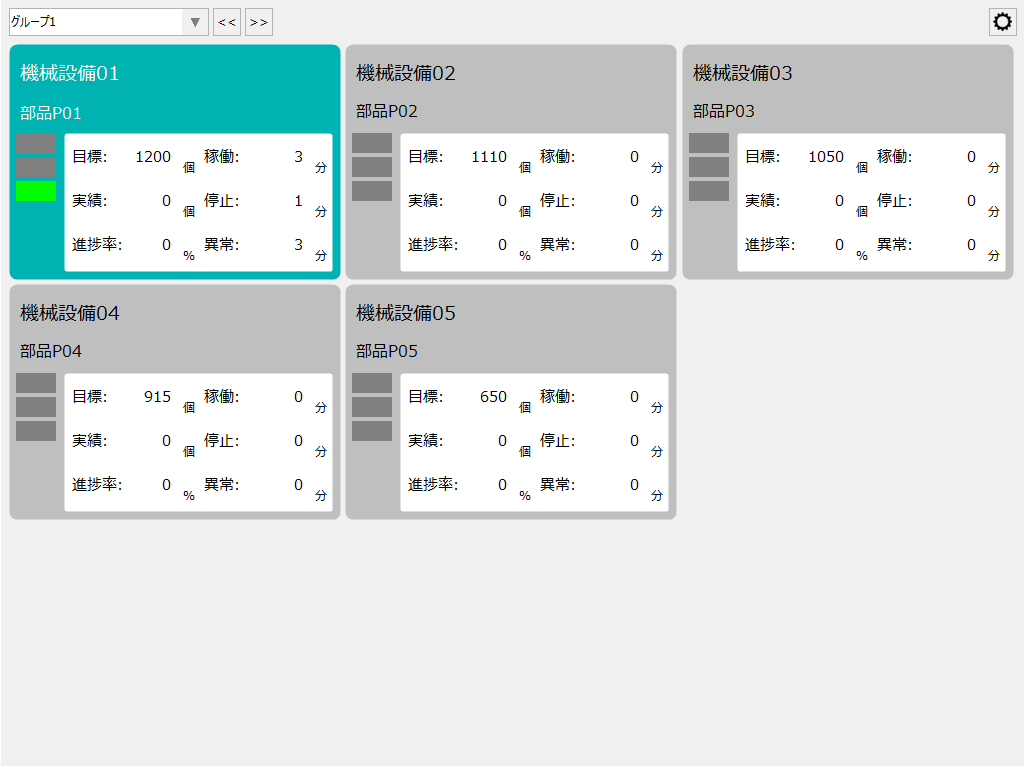
Next, turn the production result trigger tag (U01.F01.M0000) ON for a few seconds and then return it to OFF.
|
Then, the performance of Machinery Equipment 01 was increased by one.
|
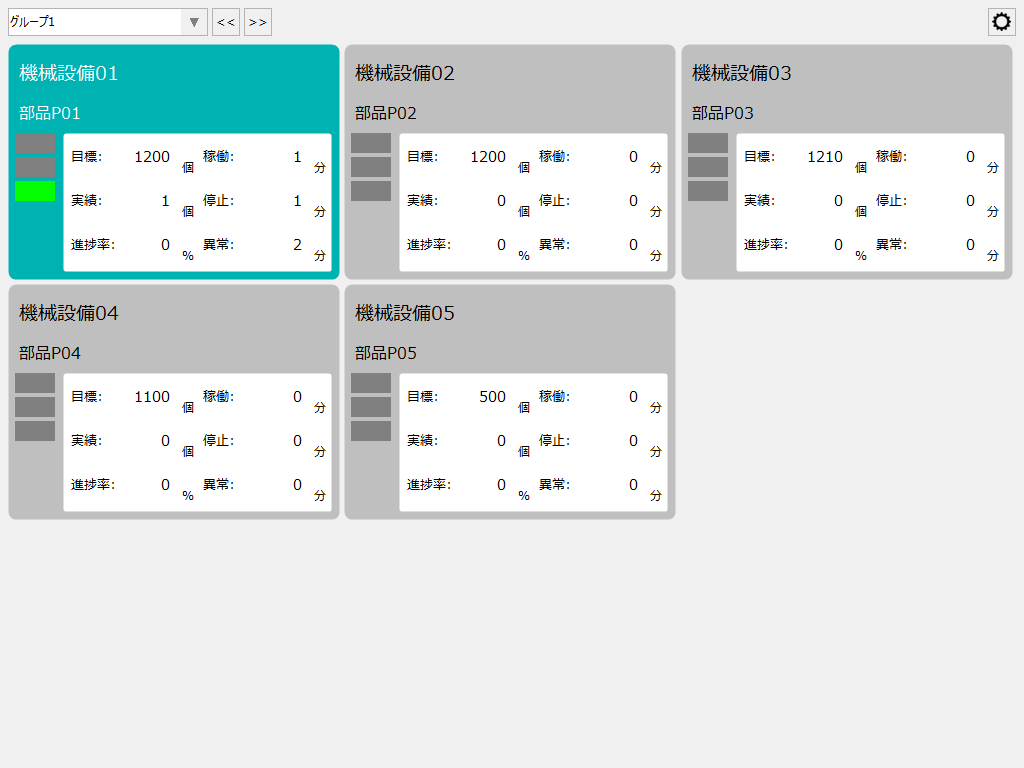
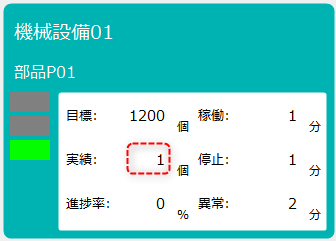
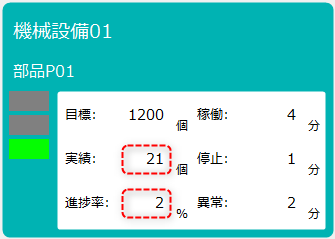
Operate the production result trigger tag several times in the manner described above, and confirm that the production results are counted up and the progress rate percentage changes.
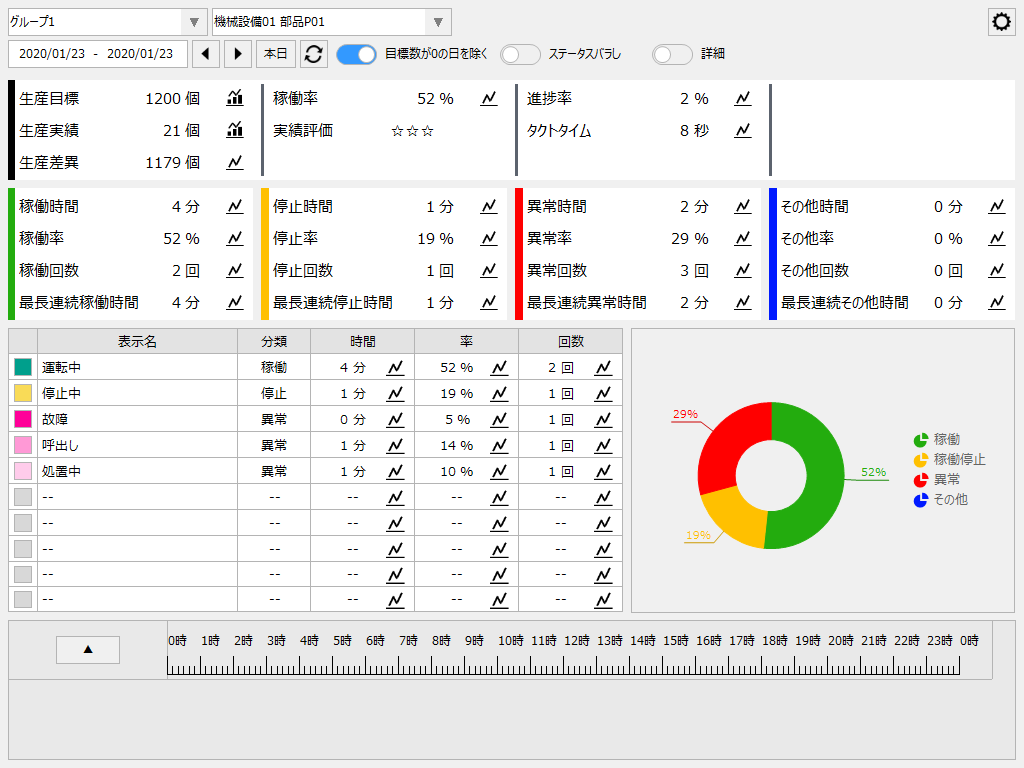
The following is an example of the operation analysis screen.
|
In addition to operating hours, abnormal hours, downtime, and operating rates, values are also reflected for production volume-related figures such as production targets, production results, production variances, progress rates, and takt times.
|
|
The operation analysis screen, bar graph screen, etc. have a display option called "Exclude days with 0 target number." By enabling this option, you can exclude data for days with 0 set as the target number from the displayed data.
Even if you are not collecting performance data from monitored equipment, you can set a value other than 0 for operating days in the production target settings to exclude days when the equipment is not in operation.
(Setting production targets)
|