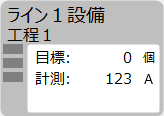
In the display data settings, you set the data items to be displayed on the operation status monitor screen.
Select "Operation Status Monitor Settings" from the menu on the left of the setting registration screen, and then select the "Display Data" tab in the center of the screen. The following will be displayed.
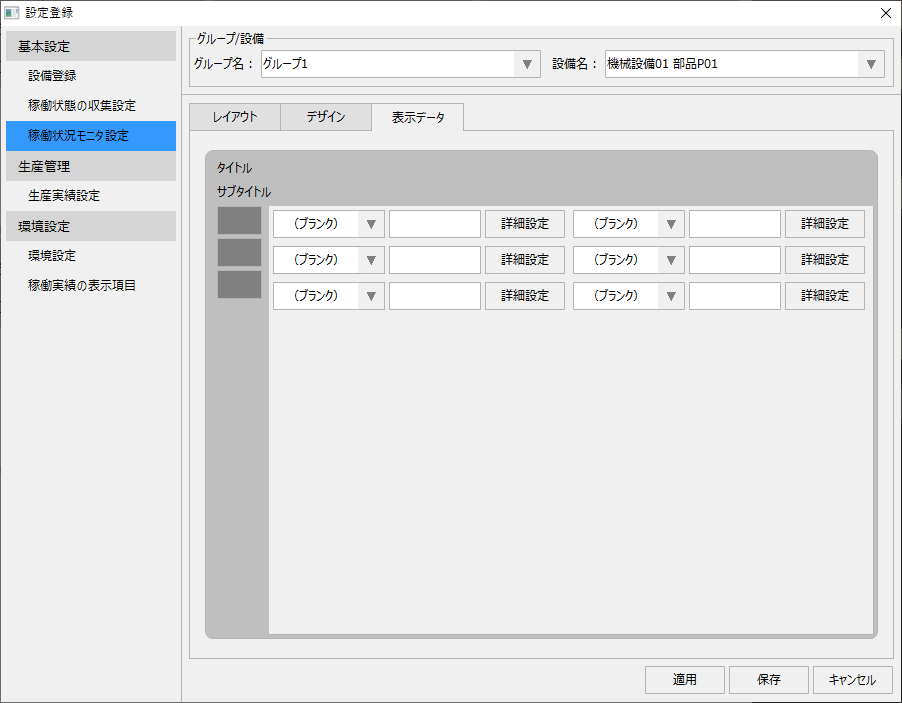
This setting must be done for each facility individually. The facility to be set can be selected from the following combo box at the top of the screen.

First, select the target group from the left combo box, then select the target facility from the right combo box.
Display data setting procedure
The procedure for editing the display data settings is explained below.
|
The content displayed on the screen will change depending on the data display layout setting in the design settings. In the example on the left, the number of display rows * 3 and the number of columns * 1 are set.
For each display data, there is a set of a combo box for selecting data items, a label edit box, and a detailed settings button.
|
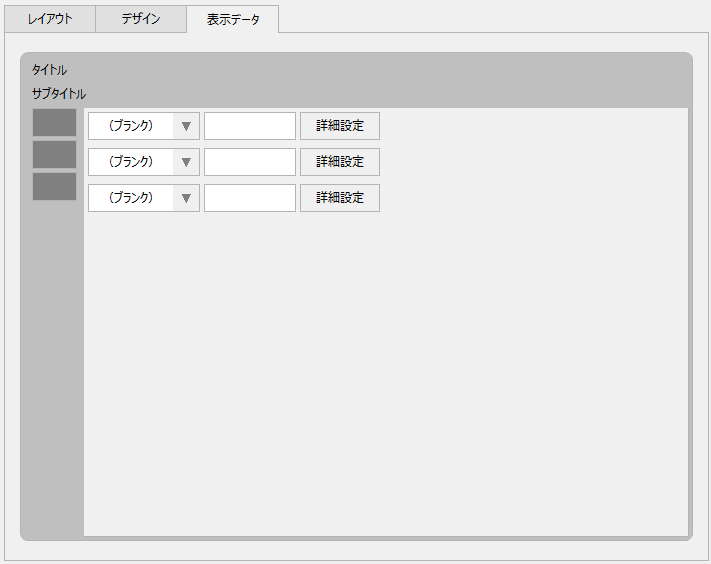

■Selecting the display data
First, select the data item you want to display in the target display position from the combo box.
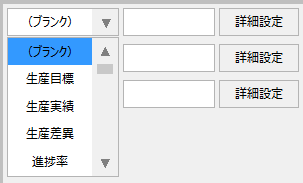
The following data items can be selected from the combo box. Please refer to "Calculation method of various numerical values" for the calculation basis of each display item such as progress rate, utilization rate, takt time, and operation time.
item |
Contents |
(blank) |
The display will be blank. |
Production Target |
Displays the production target for the day. Production targets can be set from "Production Results Settings". |
actual production |
Displays the production results for the day. |
Production variance |
Displays the difference between the production target and actual production results for the day. |
Utilization rate |
Displays the occupancy rate for the current day. |
Progress rate |
Displays the progress rate against the production target for the day. |
Takt Time |
Displays the takt time for the current day. |
Uptime |
Displays the ON time for the day when the aggregation classification is registered as "operating" (unit: minutes). |
Abnormal Time |
Displays the ON time of the day when the operation status is registered with the aggregation classification as "Abnormal" (unit: minutes). |
Downtime |
Displays the ON time of the day for the operation status registered with the aggregation classification "stopped" (unit: minutes). |
Other time |
Displays the ON time of the day for operation status registered with the aggregation classification "Other" (unit: minutes). |
Number of times of operation |
Displays the number of times on the day when the operation status is registered with the aggregation classification set as "operating". |
Abnormal count |
Displays the number of times on the day that the operating status registered with the aggregation classification "Abnormal" occurred. |
Number of stops |
Displays the number of times on the day when the operation status is registered with the tabulation classification set as "stopped." |
Other times |
Displays the number of times on the day when the tabulation classification is registered as "Other". |
Continuous operating time |
The longest continuous ON time (longest continuous operating time) during operating hours on the day (unit: minutes). |
Continuous abnormal time |
The longest continuous ON time (longest continuous abnormal time) during abnormal times on the day (unit: minutes). |
Continuous stop time |
The longest continuous ON time (longest continuous stop time) during the stop time of the day (unit: minutes). |
Continuous Other Time |
The longest continuous ON time during other times on the day (longest continuous other time) (unit: minutes). |
ON Time 1 |
Displays the ON time (unit: minutes) for the operating status registered in Status ID:1 of this equipment on the current day. |
ON time 2 |
Displays the ON time (unit: minutes) of the operation status registered in Status ID:2 of this equipment on the current day. |
ON time 3 |
Displays the ON time (unit: minutes) for the current day of the operating status registered in Status ID:3 of this equipment. |
ON time 4 |
Displays the ON time of the equipment's operating status registered in Status ID:4 on the current day (unit: minutes). |
ON time 5 |
Displays the ON time of the equipment's operating status registered in Status ID:5 on the current day (unit: minutes). |
ON time 6 |
Displays the ON time of the equipment's operating status registered in Status ID:6 on the current day (unit: minutes). |
ON time 7 |
Displays the ON time of the equipment's operating status registered in Status ID: 7 on the current day (unit: minutes). |
ON time 8 |
Displays the ON time of the equipment's operating status registered in Status ID:8 on the current day (unit: minutes). |
ON time 9 |
Displays the ON time of the equipment's operating status registered in Status ID:9 on the current day (unit: minutes). |
ON time 10 |
Displays the ON time for the current day of the operating status registered in Status ID: 10 of this equipment (unit: minutes). |
ON count: 1 |
Displays the number of times that the equipment's operating status registered in Status ID:1 was ON on the current day. |
ON count: 2 |
Displays the number of times that the equipment's operating status registered in Status ID:2 was ON on the current day. |
ON count: 3 |
Displays the number of times that the equipment's operating status, registered in Status ID 3, was ON on the current day. |
ON count: 4 |
Displays the number of times that the equipment's operating status registered in Status ID: 4 was ON on the current day. |
ON count: 5 |
Displays the number of times that the equipment's operating status, registered in Status ID: 5, was ON on the current day. |
ON count: 6 |
Displays the number of times that the equipment's operating status, registered in Status ID: 6, was turned ON on the current day. |
ON count: 7 |
Displays the number of times that the equipment's operating status, registered in Status ID 7, was ON on the current day. |
ON count: 8 |
Displays the number of times that the equipment's operating status, registered in Status ID 8, was ON on the current day. |
ON times 9 |
Displays the number of times that the equipment's operating status, registered in Status ID: 9, was ON on the current day. |
ON count: 10 |
Displays the number of times that the equipment's operating status, registered in Status ID: 10, was turned ON on the current day. |
Monitor |
When you select a monitor, you can assign any tag value to the displayed data. You can assign tags to be displayed from the detailed settings dialog. For information on how to set up the monitor display, see "Monitor display settings for displayed data" on this page. |
■ Specifying a label
Next, enter the label to be displayed at the beginning of the displayed data.

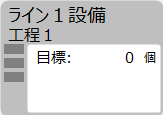
The label entered here will be displayed on the operation status monitor screen along with the displayed data. For example, enter easy-to-understand text such as "Operation time:", "Progress rate:", or "Quantity:".
(Example)

(Example of the operation status monitor display)
Detailed settings for display data
Click the button below to display the detailed settings dialog.

(Advanced Settings Dialog)
|
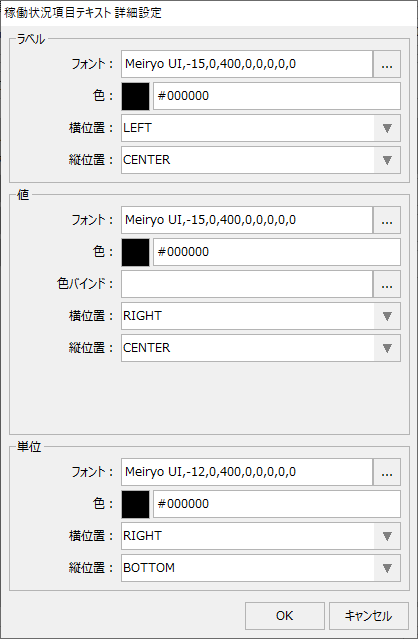
The Advanced Settings dialog allows you to make detailed settings for the labels, values, and units displayed on the operation status monitor.
When setting the labels and units, you can change the font, color, display position, and vertical alignment of each.
(Font Settings Dialog)
|
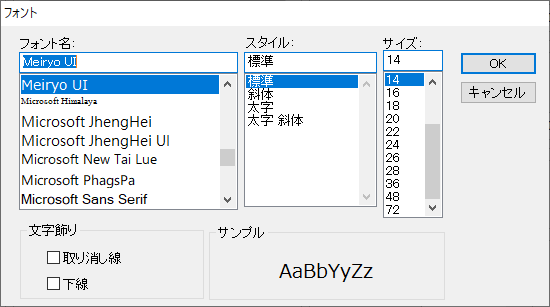
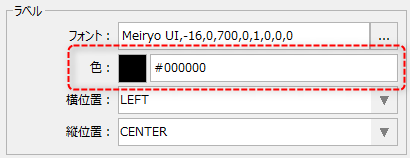
To specify the display color, please use the color settings displayed at the bottom of the font, not the font settings.
In the value settings, you can set the "color bind".

Clicking the selection button "..." to the right of the color bind will display the bind setting dialog shown below.
(Binding Settings Dialog)
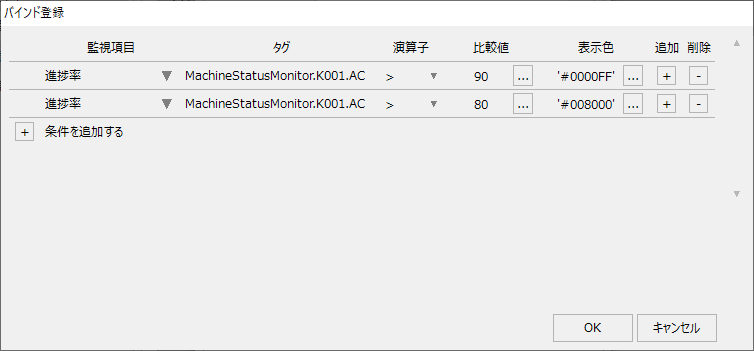
From this dialog, you can set the display color to change depending on the value conditions. For example, you can change the color of the displayed numerical value depending on the progress of the progress rate. The registered conditions are evaluated from top to bottom. If you want the progress rate to be blue when it is 90 or more, and green when it is 80 or more, define the comparison condition with 90 on the first line, and the comparison condition with 80 on the second line. If none of the conditions set in the binding settings apply, the display color initially set as the "color" of the value will be used as the default value.
Monitor display settings for display data
If you select "Monitor" as the display data, you can display the value of any tag as the display data.
First, select "Monitor" from the display data combo box as shown below.
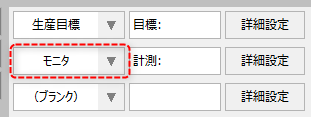
Next, click the "Advanced Settings" button to display the Advanced Settings dialog.
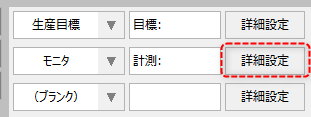
(Advanced Settings Dialog)
|
When "Monitor" is selected as the data item, the following setting items will be displayed in the value settings of the Advanced Settings dialog: "Value bind", "Value bind type", "Number of decimal places", and "Unit".These settings are only displayed when "Monitor" is selected..
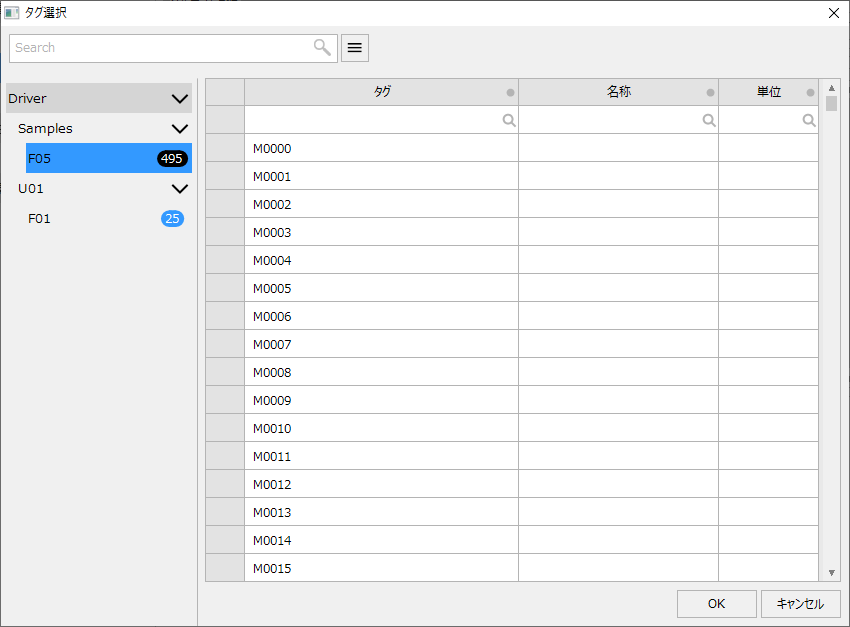
If you click the selection button "..." displayed to the right of "Value Binding", a tag selection dialog like the one shown below will be displayed. You can select the desired tag from this dialog, or you can enter the tag path directly into the value binding edit box.
(Tag selection dialog)
(Example)
|
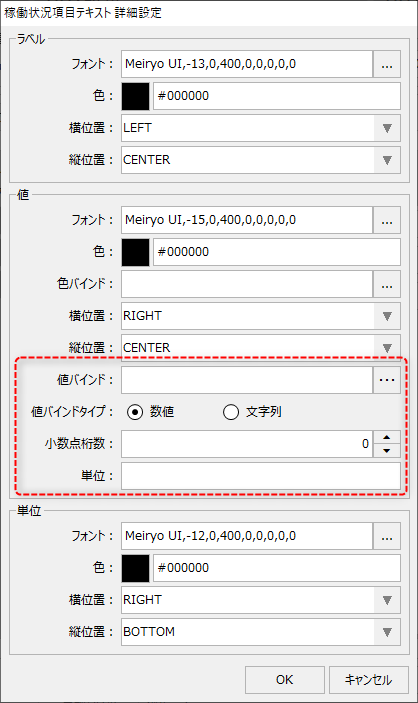

In the value bind type, specify whether the data to be displayed is a number or a string. For example, if you want to display the ASCII string obtained from the tag as is, select String. Note that the number of decimal places setting is only valid when a number is specified as the value bind type.
Below is an example of tag values displayed on a monitor.