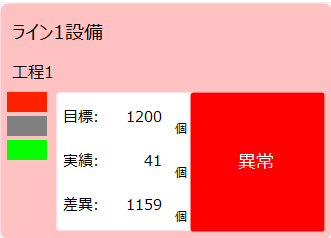
Viewing Design Settings
The design settings allow you to configure the appearance of each display frame on the operation status monitor screen.
Select "Operation Status Monitor Settings" from the menu on the left of the setting registration screen, and then select the "Design" tab in the center of the screen. The following will be displayed.
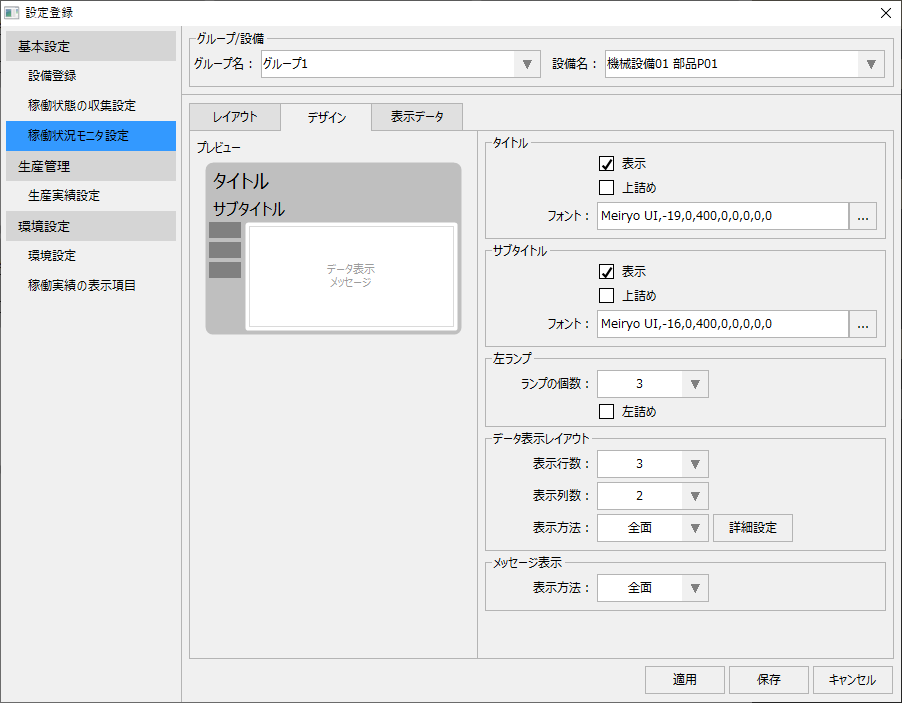
This setting must be done for each facility individually. The facility to be set can be selected from the following combo box at the top of the screen.

First, select the target group from the left combo box, then select the target facility from the right combo box.
Design Setup Steps
The procedure for editing design settings is explained below.
■ Setting the title/subtitle
|
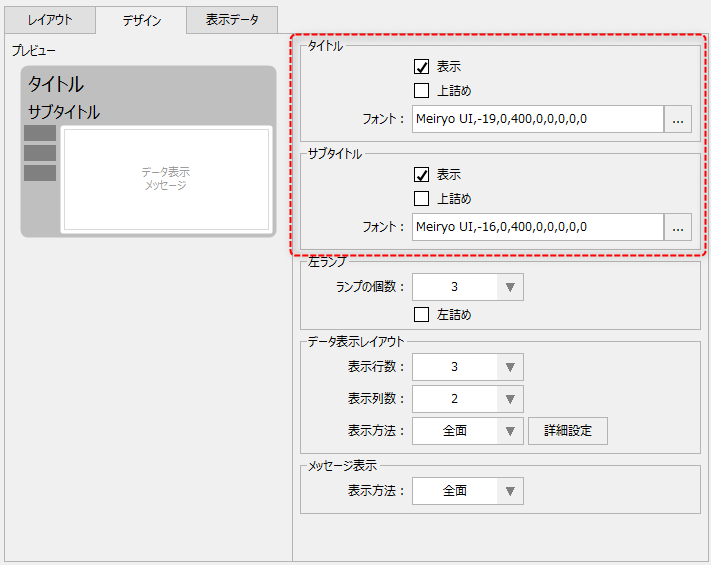
Set the display settings for the title and subtitle that were set when registering the facility.
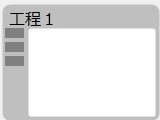
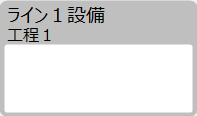
You can hide the title display in the display frame by unchecking "Show." Also, if you check "Align top" while it is hidden, the display positions of other display items will be aligned upwards.
(Example of subtitles hidden/top-justified)
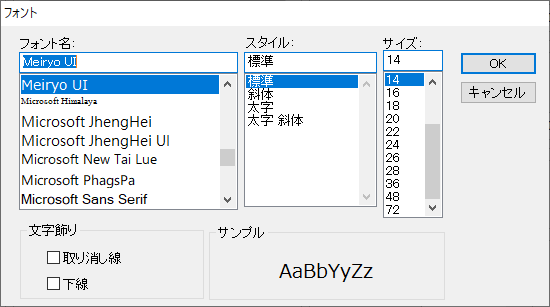
To set the font, click the selection button below to display the font setting dialog.
|

(Font Settings Dialog)
|
In the font settings dialog, you can change the following settings. Changing other items is not supported.
•Font Name •Styles: normal, bold (availability of italics depends on the font type) •size •Among the character decorations, strikethrough and underline (color cannot be specified here)
|
■ Left lamp settings
|
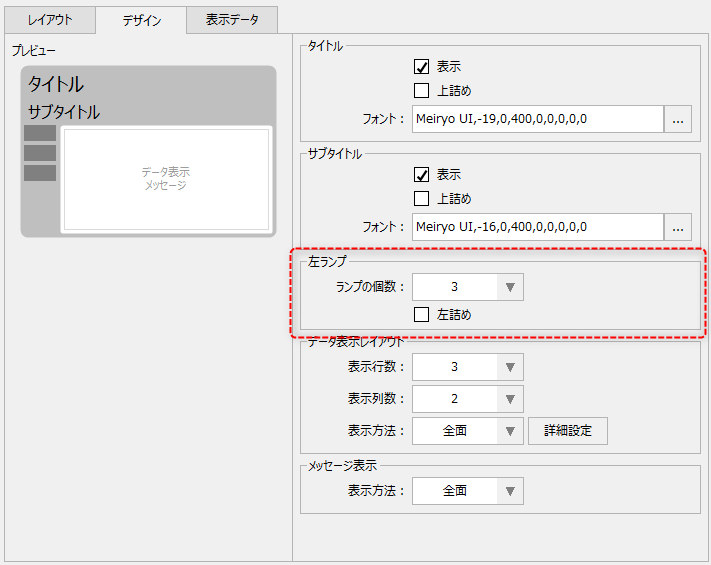
The left lamp settings are for the lamps that are displayed vertically in the left column of the display frame.
By changing the number of lamps, you can specify the number of left lamps up to a maximum of five. If you do not want to display it, specify 0.
Furthermore, if you set the number of lamps to 0 and check "Left justified," the display positions of other display items will be justified to the left.
(Example of 0 lamps/justified to the left)
|
■ Setting the data display layout
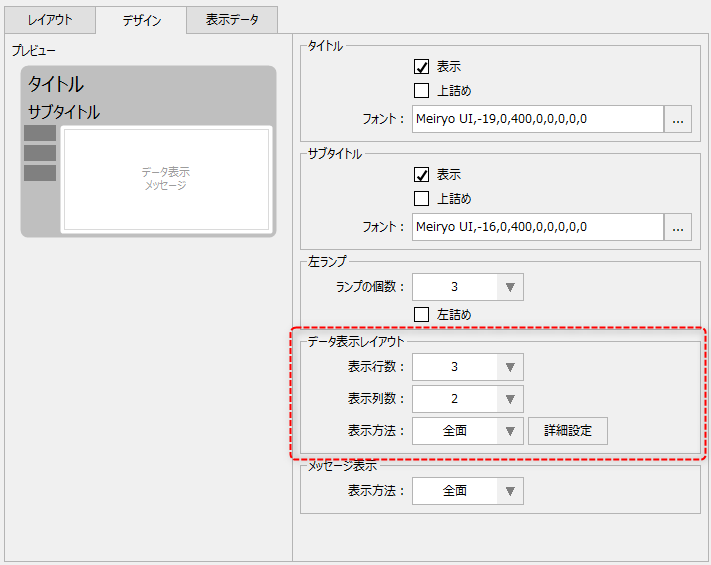
When setting the data display layout, you set the data items to be displayed within the display frame.
|
Typical data that can be displayed in data items include operation time, abnormal time, downtime, operation rate, production target, and production results, but here you can set how many rows and columns the display items will be displayed in. Up to 10 rows and 2 columns can be set.
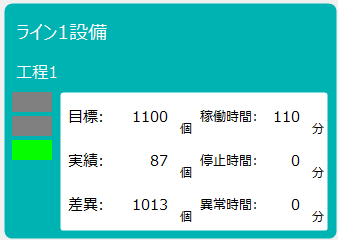
For example, if you set the number of display rows to 3 and the number of display columns to 2, then up to 6 types of data items can be displayed within the display frame. Note that only the layout on the screen is set here, and the actual display items are set separately in "Display Data Settings".
The "Display Method" setting in the data display layout sets the display position of the data display within the display frame. Here, you can select how the data is displayed within the data display area of the display frame from among "Full screen," "Left only," or "Right only." This setting is used in combination with the message display method described below. For example, by setting the number of display columns to 1 and the number of rows to 1, with the data display set to "Left only" and the message display method set to "Right only," you can set it so that data is always displayed on the left half and messages are always displayed on the right half.
(Example: Number of display rows: 3, Number of display columns: 2, Display method: Full screen)
|
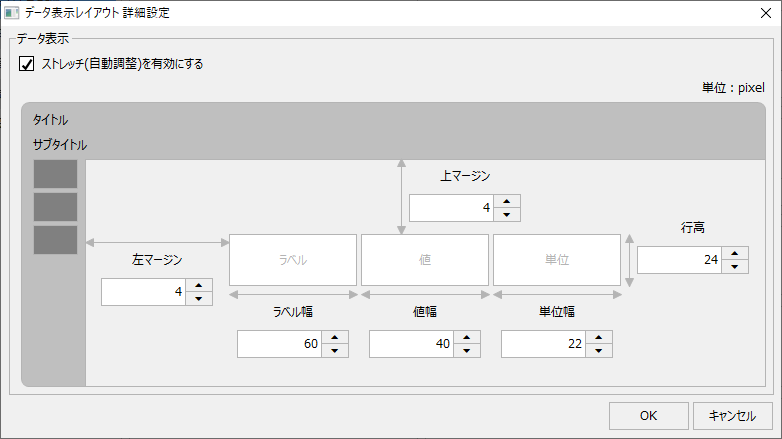
Clicking the "Advanced Settings" button on the data display layout will display the advanced layout settings dialog.
(Data display layout: Advanced settings)
|
In the Advanced Settings dialog, you can set detailed settings for the display position of data display. If necessary, you can specify the display size of labels, values, etc. in pixels.
In most cases, we recommend that you check "Enable stretch (auto-adjust)". By enabling this setting, the display will be automatically adjusted to the best possible display even when the screen is enlarged or reduced.
|
■ Message display settings
|
The message display settings allow you to set the message display to be displayed within the display frame.
Message display is a function that displays a message on top of the normal data display when an operating condition such as a failure or abnormality occurs. Whether or not to enable message display can be set individually for each operating condition from the detailed settings dialog of "Operating condition collection settings".
Here, you can select how the message will be displayed within the data display area of the display frame from among "Full screen," "Left only," or "Right only."
|
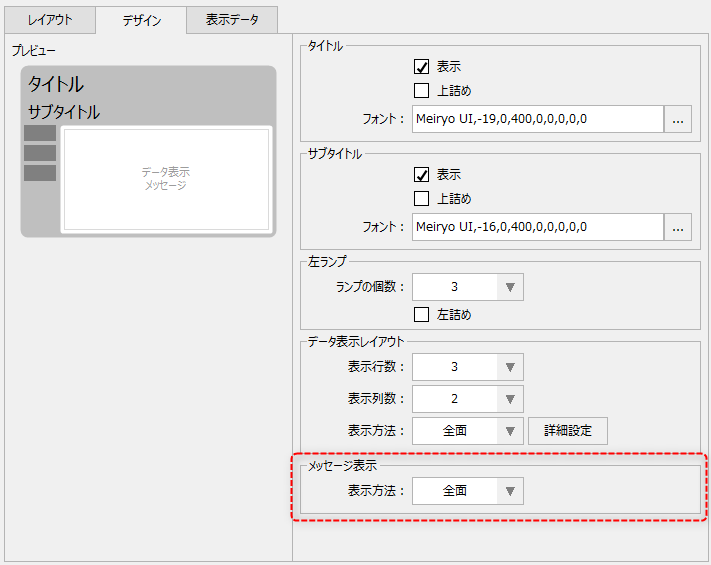
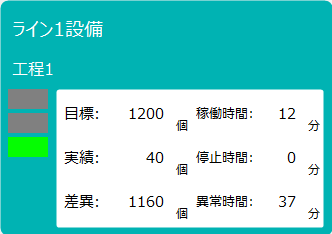
The following is an example of the normal display.
(Normally: 2 columns x 3 rows)
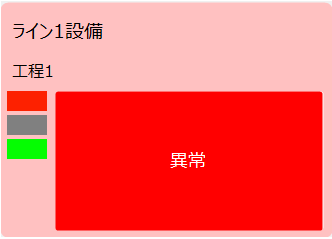
Below is an example of the display when the display method is set to "Full screen." The message is displayed over the entire data display area.
(Example of "full-page" display method)
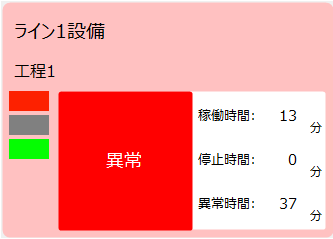
Below is an example of the display when the display method is set to "Left only." The message is displayed overlaid on the left half of the data display.
(Example of "Left only" display method)
Below is an example of the display when the display method is set to "Right only." The message is displayed overlaid on the right half of the data display.
(Example of display method "Right only")