Viewing health collection settings
When you select "Operation Status Collection Settings" from the menu on the left of the settings registration screen, the display in the center of the screen will change as shown below.
(Settings registration screen: Operation status collection settings)
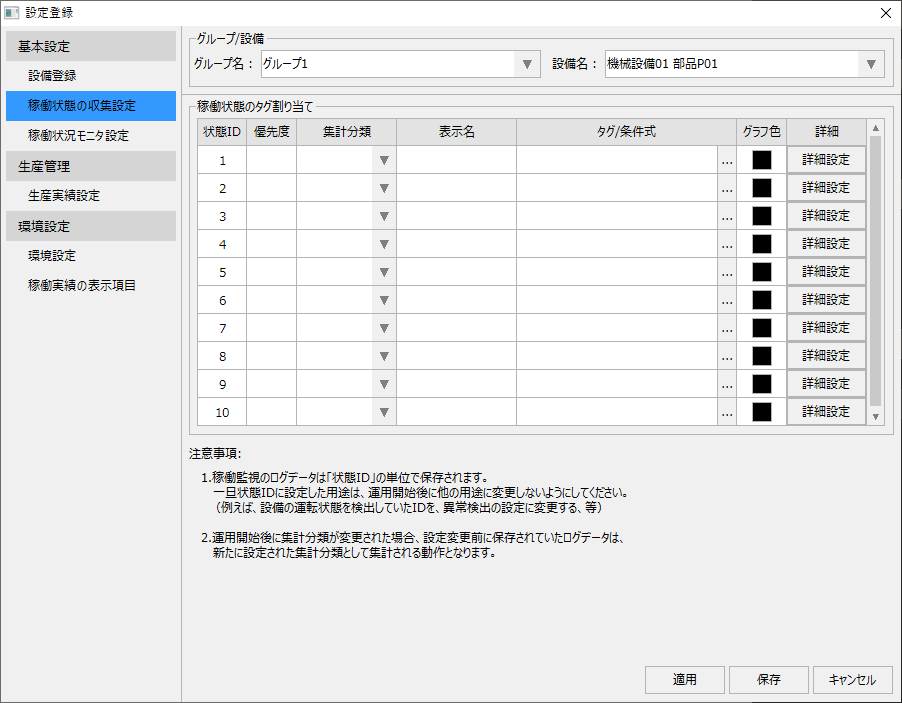
This setting must be done for each facility individually. The facility to be set can be selected from the following combo box at the top of the screen.

First, select the target group from the left combo box, then select the target facility from the right combo box.
Procedure for setting the operating state
The procedure for setting the operating status is explained below.
■ Registering operation status and assigning tags
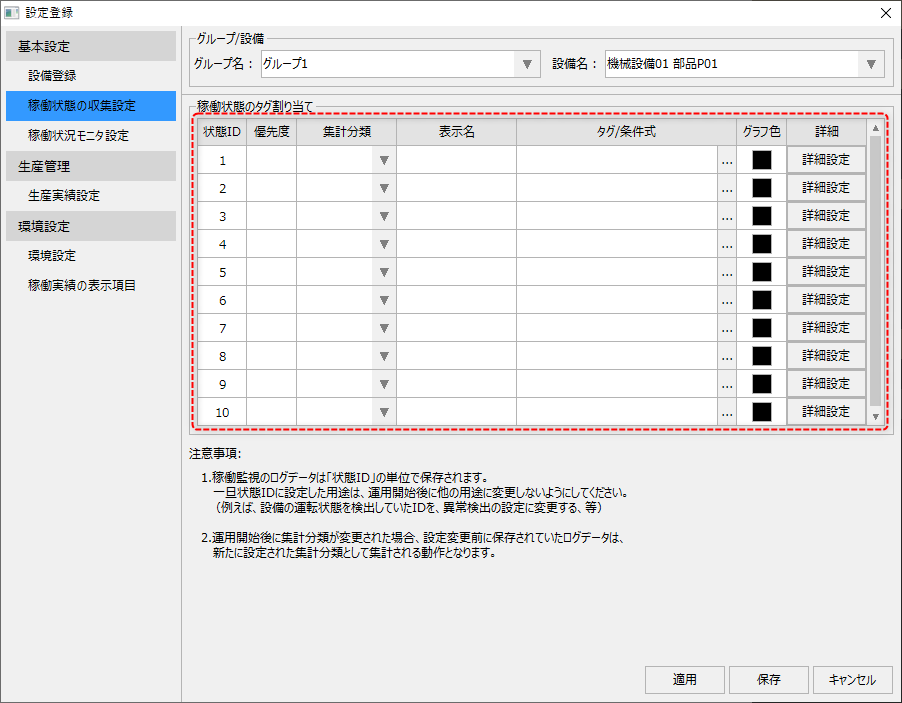
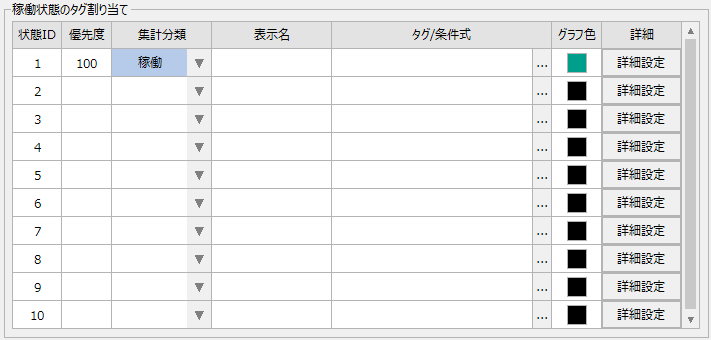
You can register the operating status from the following list displayed in the center of the screen.
The list has 10 input rows pre-populated, with "status IDs" assigned to the left column. Within the operation monitoring function, 10 areas are pre-allocated to each equipment's operation status. These operation status areas are assigned consecutive numbers from 1 to 10, and these numbers are called "status IDs."
Furthermore, up to 10 operating conditions can be registered for each piece of equipment, but it is not necessary to specify all 10; simply specify only the conditions you wish to monitor.
|
In operation monitoring, the system is set up so that aggregation processing is performed automatically for each status ID and aggregation classification. Care must be taken when changing the settings of an already configured status ID after the system has started operating. For details, see "(Important) Points to note when changing settings after starting operation". |

First, select the aggregate classification.
|
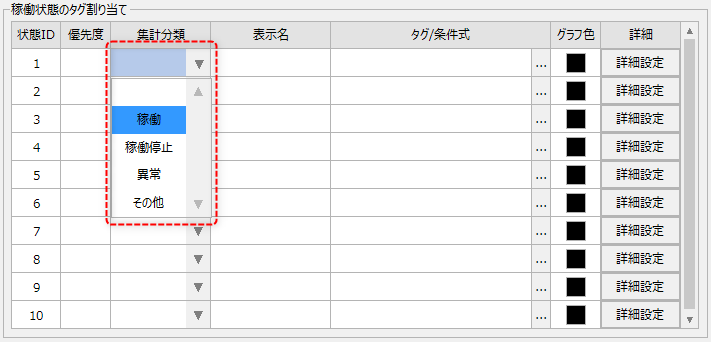
For the aggregation classification, select the desired classification from "Operation", "Stopped", "Abnormal", or "Other".
As an example, select "Operating" as the classification for status ID "1".
For information on the concept of aggregate classification, please refer to "About the aggregate classification of operating status".
|
Then, the default settings for priority and graph color will be displayed as shown below. These settings can be freely changed as needed.
|
Priority is a number that indicates which operating status is displayed first when multiple operating statuses are met at the same time. The lower the number, the higher the priority. For more information on priorities, please refer to "Priority of Operating Status".
"Display name" is the label given to the target operating status. Please directly enter an easy-to-understand name such as "Running" or "Stopped". The display name specified here will be displayed in messages displayed on the operation status monitor.
Tag/Condition Expression specifies the tag or condition expression to detect the occurrence of the operating state.
The graph color is used as the display color when detailed display is performed on timelines, monthly layered graphs, etc. These colors can also be freely changed, but you can also use the recommended values as they are. |
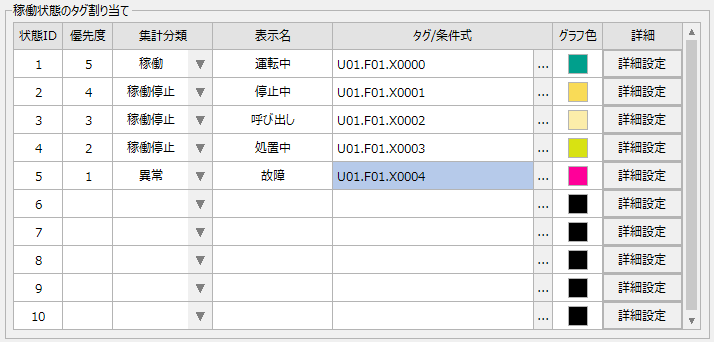
Below is an example of an actual setup.
|
In the example on the left, five operating states are registered: "In operation," "Stopped," "Call," "Processing," and "Broken." In this example, the priority is set to broken (1) higher than in operation (5). By setting it in this way, when the operating signal is ON and the fault signal is also ON, the fault will be displayed first on the operation status monitor. |
■ Editing tags/conditional expressions
Clicking the tag/condition expression selection button "..." displays the condition expression setting dialog.
(Conditional Expression Setting Dialog)
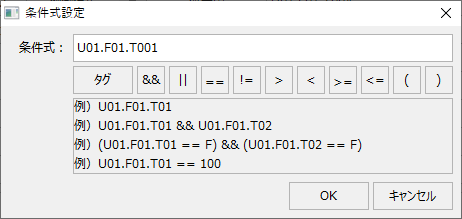
In this dialog, you can write expressions by clicking buttons such as arithmetic expressions. You can also enter conditional expressions directly in the edit box.
In addition to simply specifying a single tag path, this screen also allows you to write a logical expression that references multiple tags.
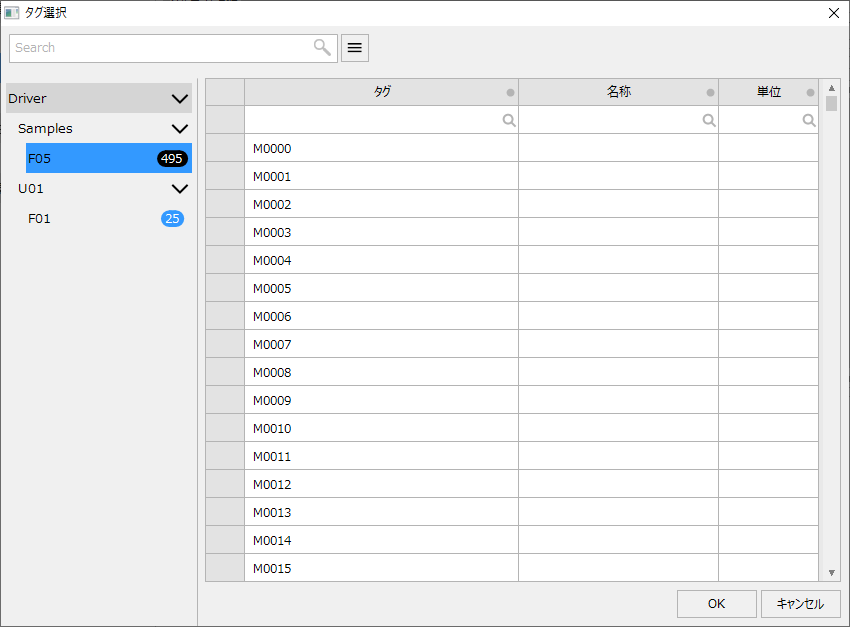
In addition to entering the tag path directly, you can also select it from the tag selection dialog that is displayed by clicking the "Tag" button above.
(Tag selection dialog)
■ Editing graph colors
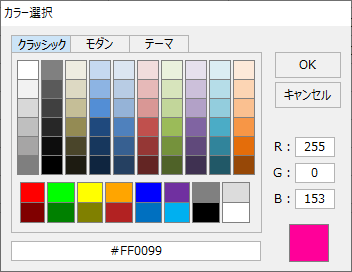
When you click on the graph color input box, the following color selection dialog will appear, allowing you to select a color.
The list of health collection settings has an "Advanced Settings" button as shown below.
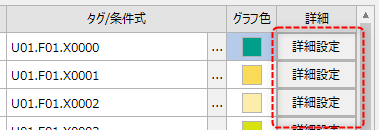
Click this button to display the advanced settings dialog for the health state of the selected row.
(Operation Status: Advanced Settings Dialog)
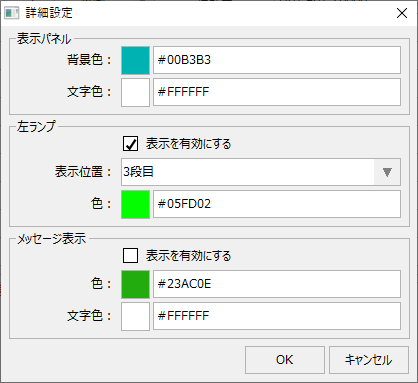
The detailed health settings are described below.
|
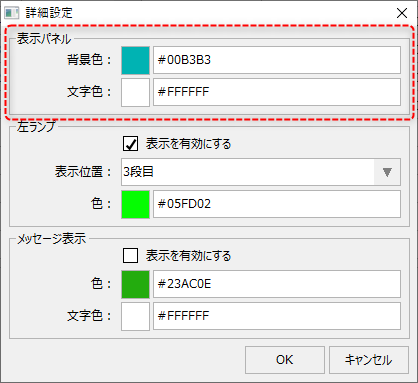
In the display panel settings, you can set the background color and text color for the display frame of the operation status monitor when the operation status conditions are met. This setting allows you to change the display color according to the operation status.
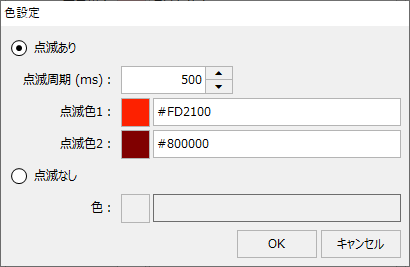
In addition, in the settings dialog where you specify the color, you can set whether or not to make the color blink.
(Color setting dialog: Blinking can be specified)
|
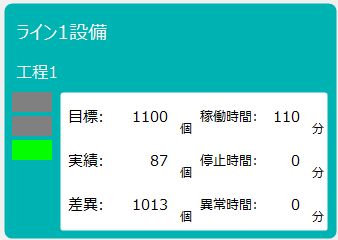
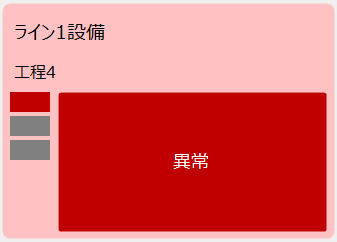
|
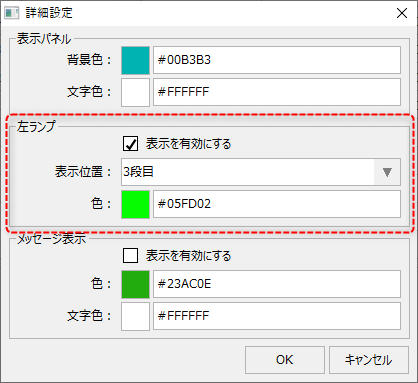
The left lamp settings are used to configure the left lamp displayed in the operation status monitor display frame.
If you check "Enable display", the left lamp will be displayed when the product is in production. The display position can be specified by which level of the left lamp you want it to be displayed.Specify which row to display from the topPlease do.
The color is specified as the color to be displayed on the left lamp. You can also set whether or not to flash the color of the left lamp.
|
|
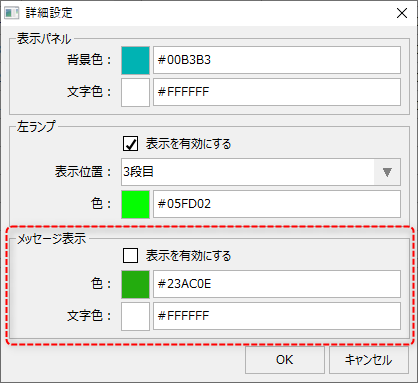
The message display setting allows you to set whether or not to display a message in the center of the operation status monitor's display frame when the operating condition is met. Message display is mainly used to display information when a situation other than normal occurs. This setting allows you to display a message in the center of the display frame, for example, when an abnormality occurs.
You can also set the message display color to blink or not.
|