Demand monitoring settings screen
This is the setting screen for registering basic information about demand.
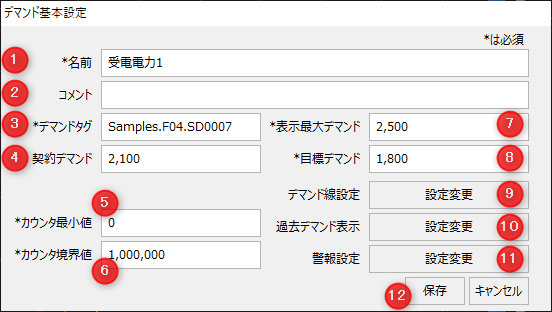
# |
name |
explanation |
||||
|---|---|---|---|---|---|---|
1 |
name |
Sets the name of the demand.
|
||||
2 |
comment |
Set any comment.
|
||||
3 |
Demand Tags |
Set the tag path to obtain the measured value (counter value) of the amount of electricity. Metering counter for received power amount, etc.
|
||||
4 |
Contract Demand |
Enter the setting value of the contract demand line to be displayed on the demand graph. This setting value is a guideline on the graph and is unrelated to alarm detection.
|
||||
5 |
Counter Minimum Value |
Sets the minimum ring counter value for the demand tag. If the counter is between 0 and 99999, it will be set to "0". |
||||
6 |
Counter Boundary Value |
Sets the boundary value for the demand tag's ring counter value. If the counter ranges from 0 to 99999, it will be set to "100000". If the counter increment is a decimal point, set it as follows: If the counter increment is 0.1 (maximum counter value is 999.9), specify 1000 as the counter boundary value. |
||||
7 |
Display Maximum Demand |
Sets the maximum width of the Y-axis of the demand graph.
|
||||
8 |
Target Demand |
Enter the setting value for the target demand line to be displayed on the demand graph. This setting value is a guideline on the graph and is unrelated to alarm detection.
|
||||
9 |
Demand Line Settings |
You can specify the display color of each line of contract demand, target demand, current demand, and forecast demand. Demand line setting screen is displayed.
|
||||
10 |
Display past demand |
You can set the display settings for the previous and previous-previous demand graphs. Past demand display setting screen will be displayed.
|
||||
11 |
Alarm Settings |
You can set the demand monitoring alarm threshold, display color, etc. Alarm setting screen is displayed.
|
||||
12 |
keep/ |
|
This is the setting screen for registering detailed demand information.
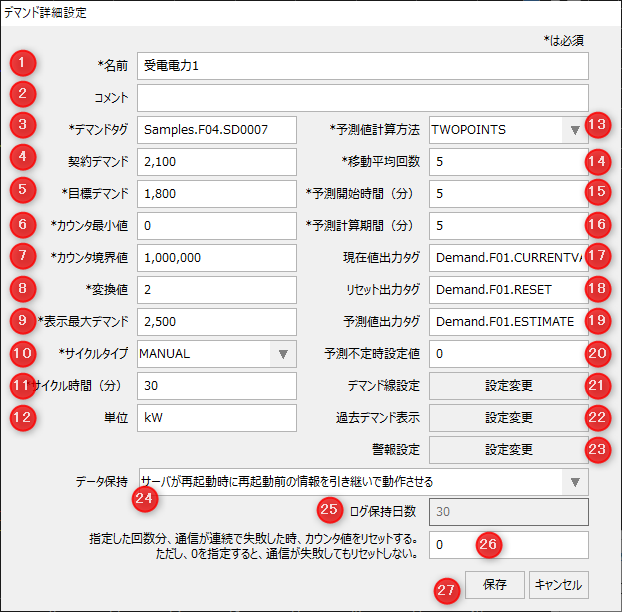
# |
name |
explanation |
||||||||
|---|---|---|---|---|---|---|---|---|---|---|
1 |
name |
Sets the name of the demand.
|
||||||||
2 |
comment |
Set any comment.
|
||||||||
3 |
Demand Tags |
Set the tag path to obtain the measured value (counter value) of the amount of electricity. Metering counter for received power amount, etc.
|
||||||||
4 |
Contract Demand |
Enter the setting value of the contract demand line to be displayed on the demand graph. This setting value is a guideline on the graph and is unrelated to alarm detection.
|
||||||||
5 |
Target Demand |
Enter the setting value for the target demand line to be displayed on the demand graph. This setting value is a guideline on the graph and is unrelated to alarm detection.
|
||||||||
6 |
Counter Minimum Value |
Sets the minimum ring counter value for the demand tag. If the counter is between 0 and 99999, it will be set to "0". |
||||||||
7 |
Counter Boundary Value |
Sets the boundary value for the demand tag's ring counter value. If the counter ranges from 0 to 99999, it will be set to "100000". If the counter increment is a decimal point, set it as follows: If the counter increment is 0.1 (maximum counter value is 999.9), specify 1000 as the counter boundary value. |
||||||||
8 |
Conversion Value |
Specify the conversion value (multiplication factor) for converting the power amount of the demand tag into demand power. Normally, the demand power is doubled from the 30-minute kW value, so specify "2".
For information on setting the conversion value, see "About setting the weight and conversion value of the weighing counter" in the Monitoring System Construction Guide.
|
||||||||
9 |
Display Maximum Demand |
Sets the maximum width of the Y-axis of the demand graph.
|
||||||||
10 |
Cycle Type |
Choose from the following two types.
Care must be taken when setting the cycle type. For details on this setting, please refer to "Demand cycle reset processing" in the Monitoring System Construction Guide.
|
||||||||
11 |
Cycle Time (min) |
Specify the time interval (in minutes) for the demand cycle. Since the demand period is generally in 30-minute units, you would normally specify "30". |
||||||||
12 |
unit |
Specify the unit to be displayed in the demand graph and the demand value list. Usually, specify "kW". |
||||||||
13 |
Forecast calculation method |
You can choose from the following three methods for calculating the slope of the forecast line.
•TWOPOINTS - Two-point calculation method •MOVING_AVERAGE ・・・Moving average method •LEAST_SQUARES_METHOD: Least squares method
For details on the calculation method, please refer to "How to calculate demand forecast" in the Monitoring System Construction Guide.
|
||||||||
14 |
Moving average count |
This is used when you select "MOVING_AVERAGE (moving average method)" as the forecast calculation method. Specifies how many past points to go back to when calculating the moving average.
|
||||||||
15 |
Estimated Start Time (min) |
After the demand cycle starts, the forecast line will not be drawn until the time (minutes) specified in the forecast start time has elapsed. |
||||||||
16 |
Forecast calculation period (min) |
When calculating the forecast line, specify how many minutes of log data from the current time back will be included in the forecast calculation. |
||||||||
17 |
Current value output tag |
The current value of the demand power is transferred to the specified tag path. |
||||||||
18 |
Reset Output Tag |
The reset status of the demand monitor is transferred to the specified tag path. A pulse is output to the reset output tag, which immediately becomes TRUE when a reset is executed and automatically returns to FALSE after a few seconds.
|
||||||||
19 |
Estimated value output tag |
The predicted demand power value is sent to the specified tag path. |
||||||||
20 |
Predicted irregular time setting value |
You can specify the value to be output as a forecast value when there is no forecast value, such as before the demand forecast start time has elapsed. The default is "0".
Also, when a manual reset is performed, if the previous value is undefined, the value set here will be set as the previous value.
|
||||||||
21 |
Demand Line Settings |
You can specify the display color of each line of contract demand, target demand, current demand, and forecast demand. Demand line setting screen is displayed.
|
||||||||
22 |
Display past demand |
You can set the display settings for the previous and previous-previous demand graphs. Past demand display setting screen will be displayed.
|
||||||||
23 |
Alarm Settings |
You can set the demand monitoring alarm threshold, display color, etc. Alarm setting screen is displayed.
|
||||||||
24 |
Data Retention |
Select how you want to retain your data:
|
||||||||
25 |
Log Retention Period |
If you select "When the server is restarted, continue to use the information from before the restart (keep logs)" in "Data retention", specify the number of days to keep the log files.
|
||||||||
26 |
The specified number of times... |
When communication fails consecutively the specified number of times, the counter value is reset. This function is to prevent the forecast line from jumping up after a communication error is resolved. If 0 is specified, the counter value will not be reset even if communication fails.
|
||||||||
27 |
keep/ |
|

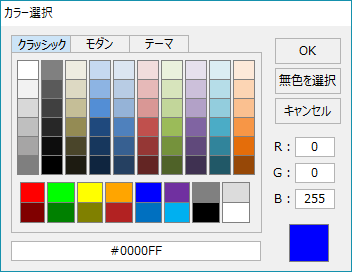
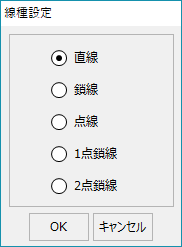
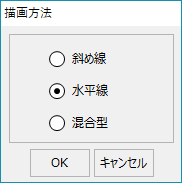
This screen sets the graph display style for contract demand, target demand, current demand, and forecast demand.
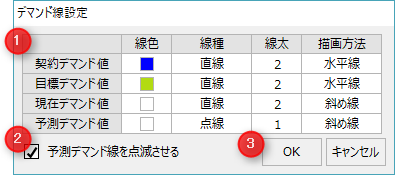
# |
name |
explanation |
||||
|---|---|---|---|---|---|---|
1 |
Line settings list |
Configure various demand lines.
•Line color •Linetype •Line Thickness •Drawing Method
|
||||
2 |
Flashing forecast demand lines |
Check this box to make the forecast demand line blink.
|
||||
3 |
OK/ |
|
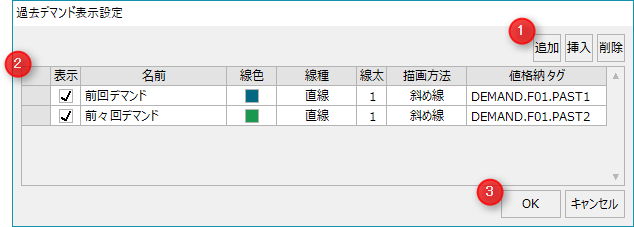
Past demand display setting screen
This screen allows you to set the display of past demand graphs.
# |
name |
explanation |
||||||||
|---|---|---|---|---|---|---|---|---|---|---|
1 |
Past Demand Operation |
|
||||||||
2 |
Past demand list |
Configure the past demand.
•display •name
•Line color •Linetype •Line Thickness •Drawing Method •Value storage tag
|
||||||||
3 |
OK/ |
|
This is the screen for setting the demand alarm.
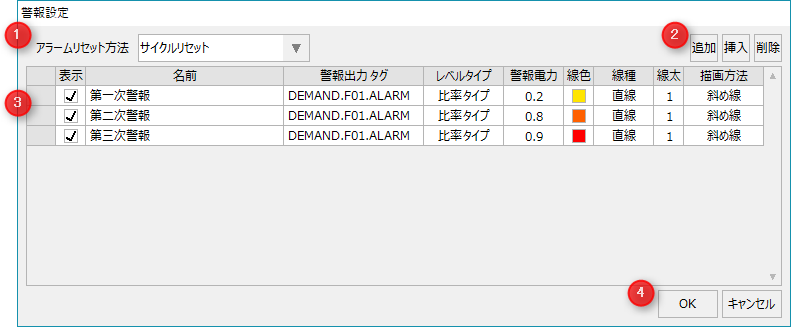
# |
name |
explanation |
||||||
|---|---|---|---|---|---|---|---|---|
1 |
How to reset the alarm |
Select how you want to reset the alarm.
•Reset forecast value
•Cycle Reset
|
||||||
2 |
Alarm Operation |
|
||||||
3 |
List of warnings |
Configure the alarm settings.
•display •name •Alarm Output Tag
•Level Type •Alarm Power •Line color •Linetype •Line Thickness •Drawing Method
|
||||||
4 |
OK/Cancel |
|