overview
Demand monitoring is configured from the settings screen while the client is running.
The method for setting up demand monitoring is explained below. Please note that the following operations should be performed while both Panel Server and Panel Browser are running online.
•Display the demand detailed settings dialog
Display the Demand Advanced Settings dialog
The following is the demand monitoring screen. Sample data is registered in the initial state.
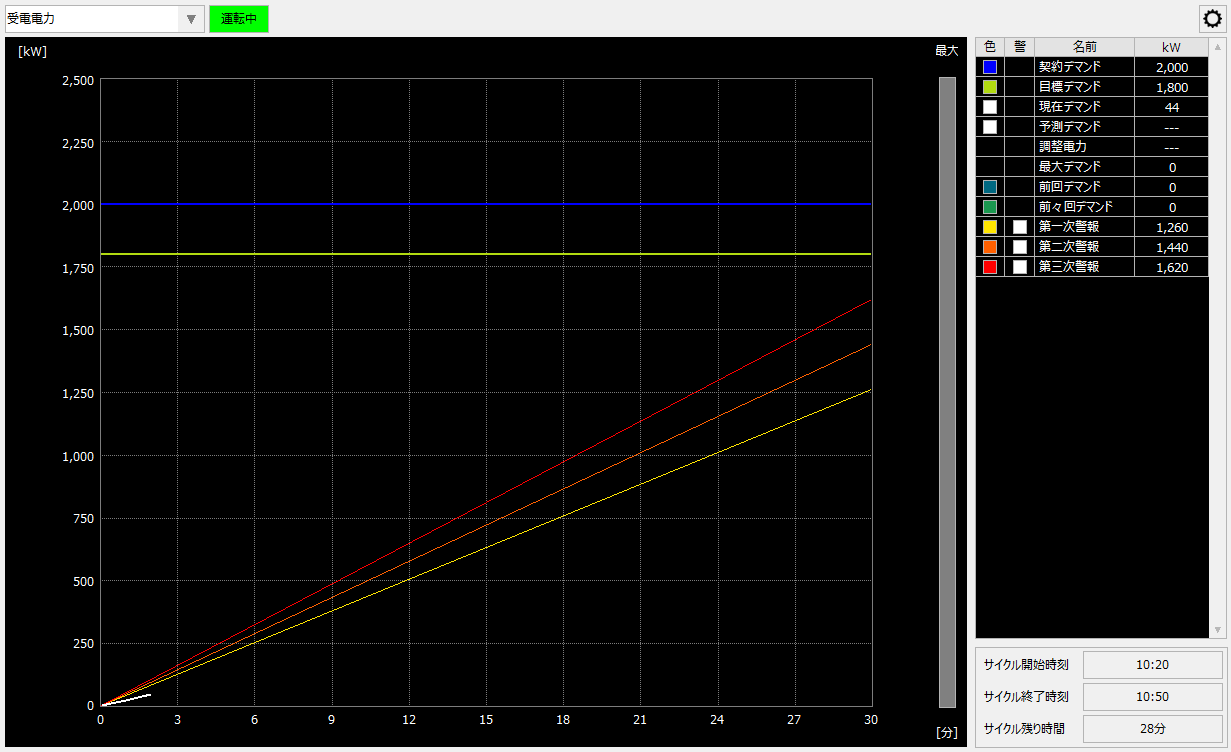
Demand monitoring is configured from the settings dialog.
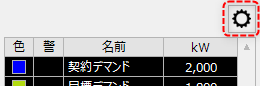
This settings dialog can be called up from the menu on the demand monitoring screen.
To display the menu, click the settings icon (gear icon) in the top right corner of the screen.
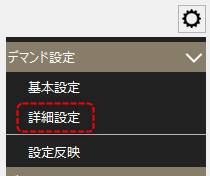
Select "Advanced Settings" from the menu displayed on the right side of the screen.
The detailed settings screen is displayed.
(Demand monitoring detailed settings screen)
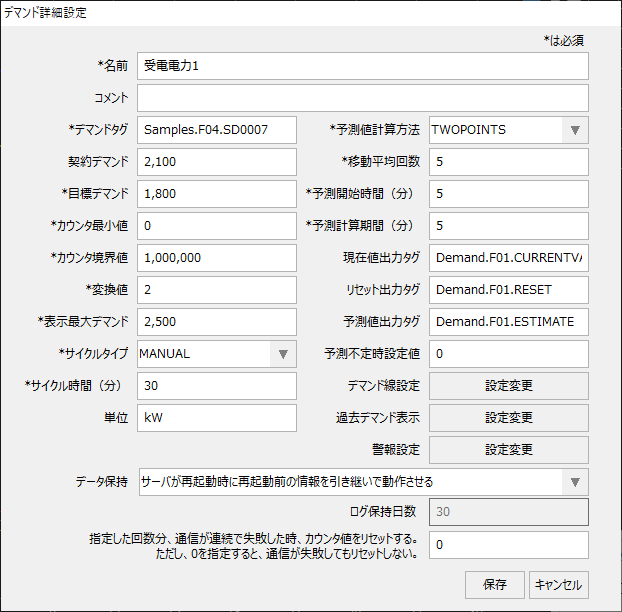
There are two types of settings screens: "Basic Settings" and "Advanced Settings". The basic settings screen contains only important settings. The advanced settings screen allows you to configure all settings.
|
For details about the items displayed on the demand monitoring settings screen, see "Demand Monitoring" in the screen library reference. |

This section explains the settings in the Advanced Settings dialog box.
For items not listed here, please refer to "Demand Monitoring" in the Screen Library Reference.
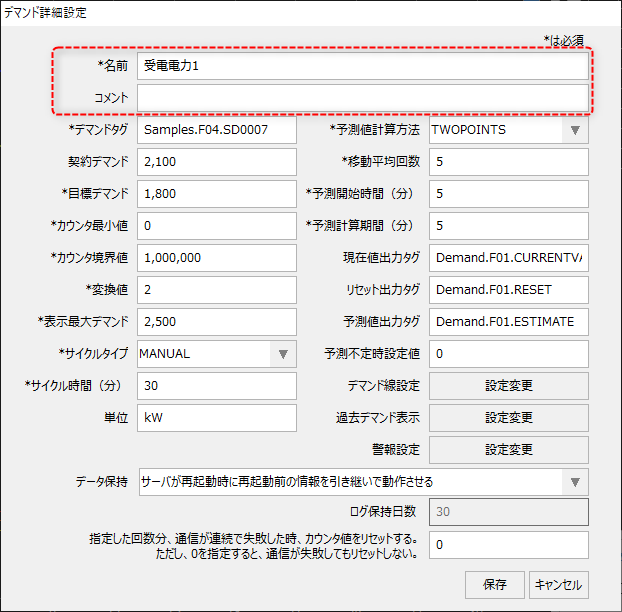
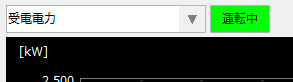
■ Demand name/comment
|
|
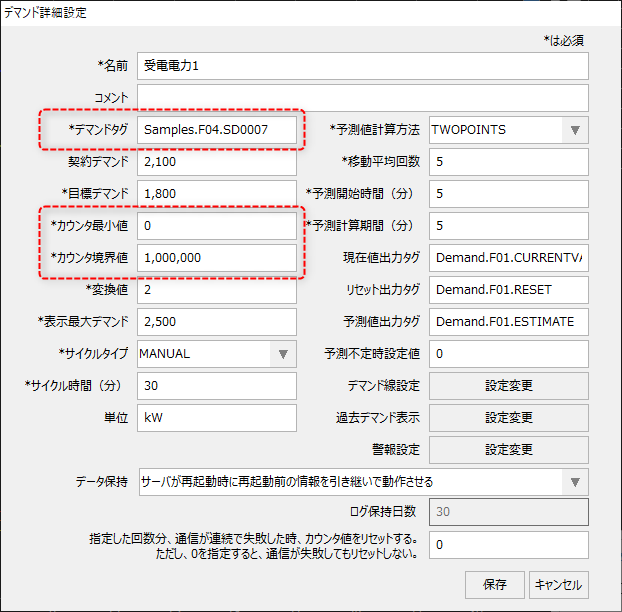
■ Demand tag/counter minimum value/counter boundary value
|
|
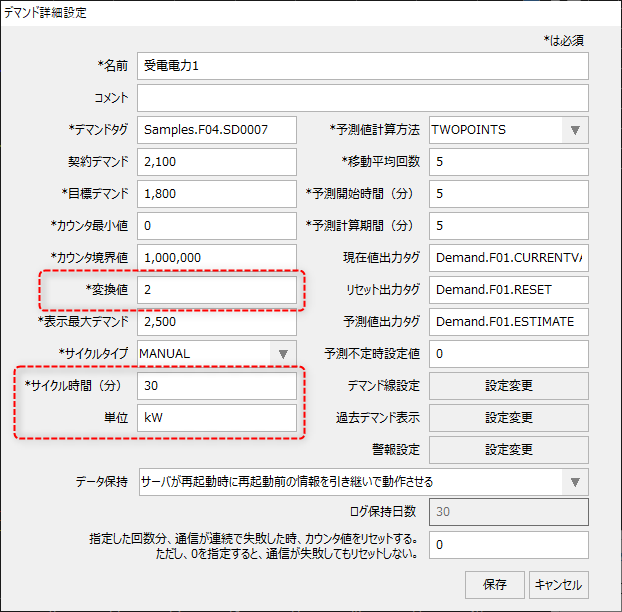
■ Conversion value/cycle time/unit
|
|
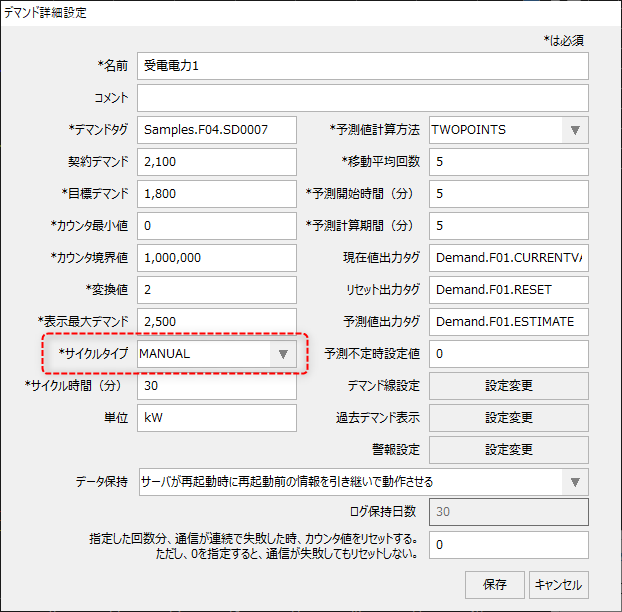
■ Cycle type
|
For the cycle type setting, select either "AUTO" or "MANUAL".
For standard projects, "MANUAL" is set.
Please be careful when setting the cycle type. For details, please refer to "Demand cycle reset process".
|
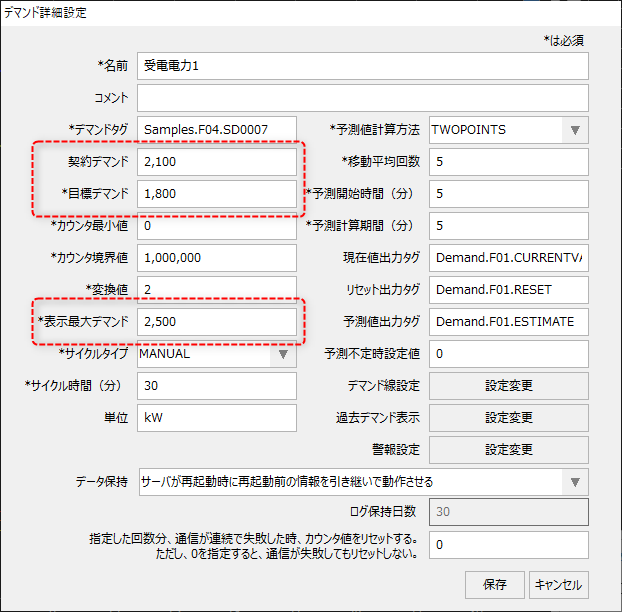
■ Contract demand/Target demand/Display maximum demand
|
|
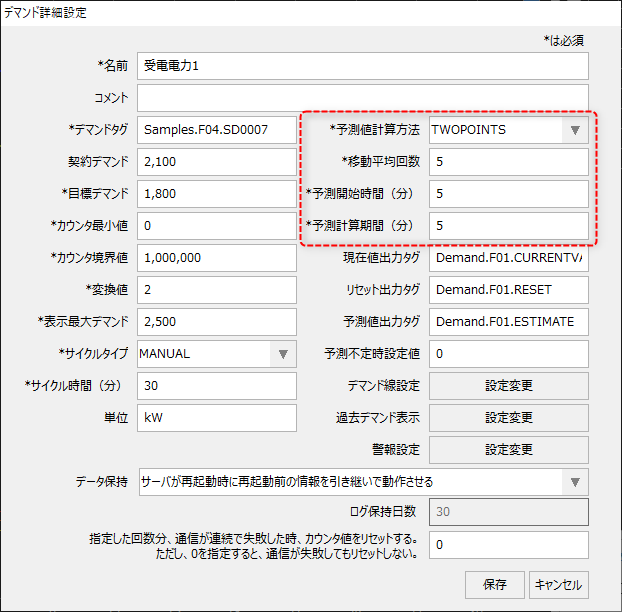
■ Forecast value calculation method/moving average count/forecast start time/forecast calculation period
|
The forecast calculation method allows you to select from the following three methods for calculating the slope of the forecast line.
•TWOPOINTS - Two-point calculation method •MOVING_AVERAGE ・・・Moving average method •LEAST_SQUARES_METHOD: Least squares method
These parameters are used to calculate the demand forecast. For details on how the forecast is calculated, please refer to "Demand forecast calculation method".
The forecast start time is the time from the start of the demand cycle until the forecast line is displayed. The forecast line will not be drawn until the time (minutes) specified here has elapsed.
|
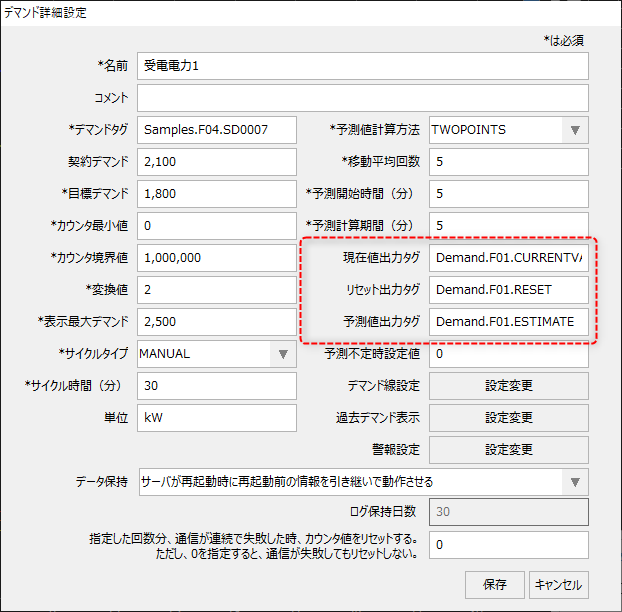
■ Current value output tag / Reset output tag / Predicted value output tag
|
The current demand value, forecast value, and reset status can be written to tags.
For information on writing demand monitoring information to tags, please refer to the description in "About tag output of demand monitoring information".
|
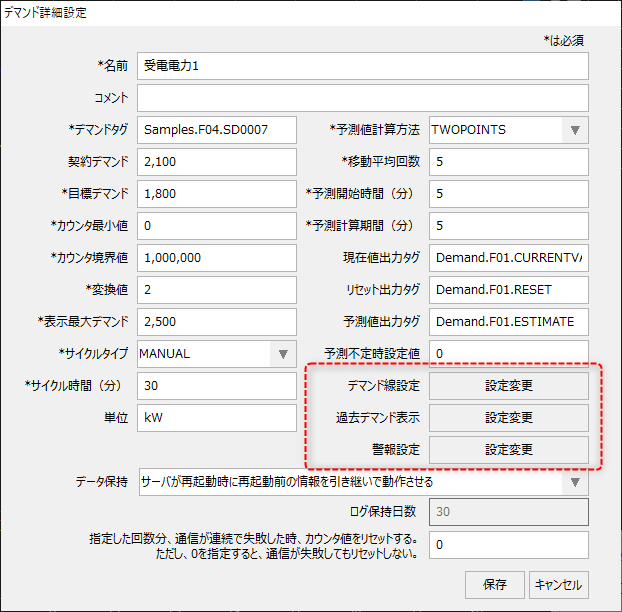
■ Demand line setting/Past demand display/Alarm setting
|
Clicking the buttons on the left will display each setting screen separately.
|
Demand lines are configured from the Demand Line Settings dialog.
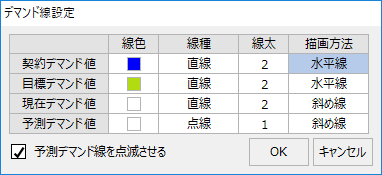
Settings are made from the grid. Line thickness can be input directly from the grid.
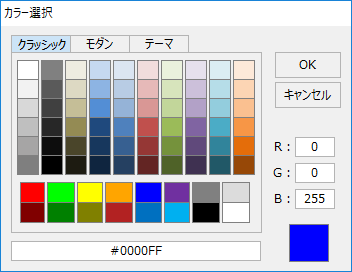
■ Changing the line color
Double-clicking on the cell will bring up a color selection dialog, from which you can select the desired color.
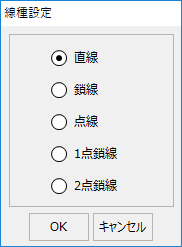
■ Changing the line type
Double-clicking on the target cell will bring up the line type setting dialog, from which you can select the desired line type.
■ Line thickness
You can specify the thickness of each line in pixels.
■ Drawing method
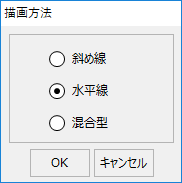
Double-clicking the target cell will display the drawing method dialog. You can select the drawing method only for the contract demand value and the target demand value. For other lines, the drawing method is fixed to "diagonal line".
Setting for displaying past demand
The display settings for past demand are configured from the Past Demand Display Settings dialog.
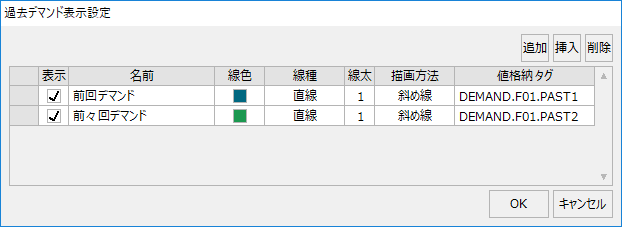
Settings are made from the grid. Display status, name, line thickness, value storage tag, etc. can be input directly from the grid.
■ Changing the line color
Double-click the cell to display the color selection dialog. Select the desired color from the dialog that appears.
■ Changing the line type
Double-click the target cell to display the line type setting dialog. Select the line type from the displayed dialog.
■ Line thickness
You can specify the thickness of each line in pixels.
■ Drawing method
Double-click the target cell to display the drawing method dialog. Select the drawing method from the displayed dialog.
■ Value storage tag
The previous demand value and the value before last demand value can be written to a tag.When using the demand history function or the demand report function, be sure to set this parameter and specify the output destination tag of the previous demand.
For information on writing demand monitoring information to tags, please refer to the description in "About tag output of demand monitoring information".
Demand alarm settings are made from the Alarm Settings dialog.
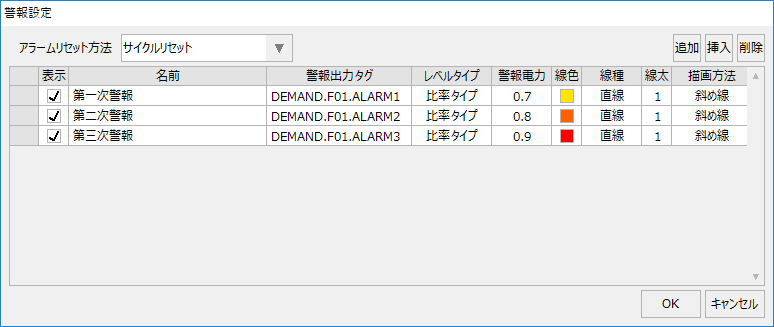
Settings are made from the grid. Display status, name, line thickness, alarm output tag, etc. can be input directly from the grid.
■Alarm output tag
The demand alarm detection status can be written to a tag. If you are using Alarm server alarm monitoring, specify the destination tag with this parameter and register it in the alarm master.
For information on writing demand monitoring information to tags, please refer to the description in "About tag output of demand monitoring information".
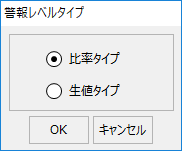
■ Level type
Double-clicking the target cell will display the alert level type selection dialog.
|
|
■ Alarm power
Set the demand alarm threshold value. Set the content according to the setting selected in Level Type.
■ Changing the line color
Double-click the cell to display the color selection dialog. Select the line color from the dialog that appears.
■ Changing the line type
Double-click the target cell to display the line type setting dialog. Select the line type from the displayed dialog.
■ Line thickness
You can specify the thickness of each line in pixels.
■ Drawing method
Double-click the target cell to display the drawing method dialog. Select the drawing method from the displayed dialog.